Resource
| Id | Histone_ChIP-seq/ENCSR021HLX |
|---|---|
| Type | position_score |
| Version | 0 |
| Summary | Histone_ChIP-seq ENCSR021HLX [biosample_summary="Homo sapiens neuronal stem cell originated from H9" and target="H2AFZ"] |
| Description |
status: released biological_replicates: Rep 2 summary: female embryo (5 days) output_type: pseudoreplicated peaks audit_internal_action: Released analysis {ENCAN059UCC|/analyses/ENCAN059UCC/} has in progress subobject quality standard {encode4-histone-chip|/quality-standards/encode4-histone-chip/} audit_internal_action: Released analysis {ENCAN059UCC|/analyses/ENCAN059UCC/} has in progress subobject document {f98e430e-cf5c-4307-99e6-000b019569e3|/documents/f98e430e-cf5c-4307-99e6-000b019569e3/} audit_warning: PBC1 (PCR Bottlenecking Coefficient 1, M1/M_distinct) is the ratio of the number of genomic locations where exactly one read maps uniquely (M1) to the number of genomic locations where some reads map (M_distinct). A PBC1 value in the range 0 - 0.5 is severe bottlenecking, 0.5 - 0.8 is moderate bottlenecking, 0.8 - 0.9 is mild bottlenecking, and > 0.9 is no bottlenecking. PBC1 value > 0.9 is recommended, but > 0.8 is acceptable. ENCODE processed alignments file {ENCFF066VHC|/files/ENCFF066VHC/} processed by ChIP-seq ENCODE4 v1.6.1 GRCh38 pipeline was generated from a library with PBC1 value of 0.82. audit_warning: PBC2 (PCR Bottlenecking Coefficient 2, M1/M2) is the ratio of the number of genomic locations where exactly one read maps uniquely (M1) to the number of genomic locations where two reads map uniquely (M2). A PBC2 value in the range 0 - 1 is severe bottlenecking, 1 - 3 is moderate bottlenecking, 3 - 10 is mild bottlenecking, > 10 is no bottlenecking. PBC2 value > 10 is recommended, but > 3 is acceptable. ENCODE processed alignments file {ENCFF066VHC|/files/ENCFF066VHC/} processed by ChIP-seq ENCODE4 v1.6.1 GRCh38 pipeline was generated from a library with PBC2 value of 5.56. |
| Labels |
|
Scores (1)
| ID | Type | Default annotation | Description | Histogram | Range | Summary |
|---|---|---|---|---|---|---|
| Histone_ChIP-seq_ENCSR021HLX | float |
Histone_ChIP-seq_ENCSR021HLX |
Histone_ChIP-seq ENCSR021HLX [biosample_summary="Homo sapiens neuronal stem cell originated from H9" and target="H2AFZ"]
|
 |
[1.66, 43.7] |
|
n counts base pairs; sd is the population standard deviation.
Coverage
| Chromosome | Covered positions | Covered % | Segments |
|---|---|---|---|
| all chromosomes | 88117581 | 2.74% | 116470 |
| chr1 | 7677975 | 3.08% | 9825 |
| chr2 | 7481187 | 3.09% | 10068 |
| chr3 | 5720789 | 2.88% | 7821 |
| chr4 | 5096839 | 2.68% | 7468 |
| chr5 | 5439547 | 3.00% | 7598 |
| chr6 | 5454784 | 3.19% | 7381 |
| chr7 | 4761233 | 2.99% | 6559 |
| chr8 | 4095376 | 2.82% | 5573 |
| chr9 | 3551280 | 2.57% | 4549 |
| chr10 | 3797011 | 2.84% | 4831 |
| chr11 | 4073569 | 3.02% | 4968 |
| chr12 | 4410402 | 3.31% | 5799 |
| chr13 | 3577933 | 3.13% | 5506 |
| chr14 | 2552357 | 2.38% | 3107 |
| chr15 | 2558447 | 2.51% | 3148 |
| chr16 | 2678062 | 2.96% | 3344 |
| chr17 | 3564104 | 4.28% | 4166 |
| chr18 | 2183256 | 2.72% | 3074 |
| chr19 | 2962962 | 5.05% | 3415 |
| chr20 | 2014520 | 3.13% | 2526 |
| chr21 | 859758 | 1.84% | 1189 |
| chr22 | 1475023 | 2.90% | 1783 |
| chrX | 2131167 | 1.37% | 2772 |
| 3343 contigs with no values (186304500 bp) | 0 | 0.00% | 0 |
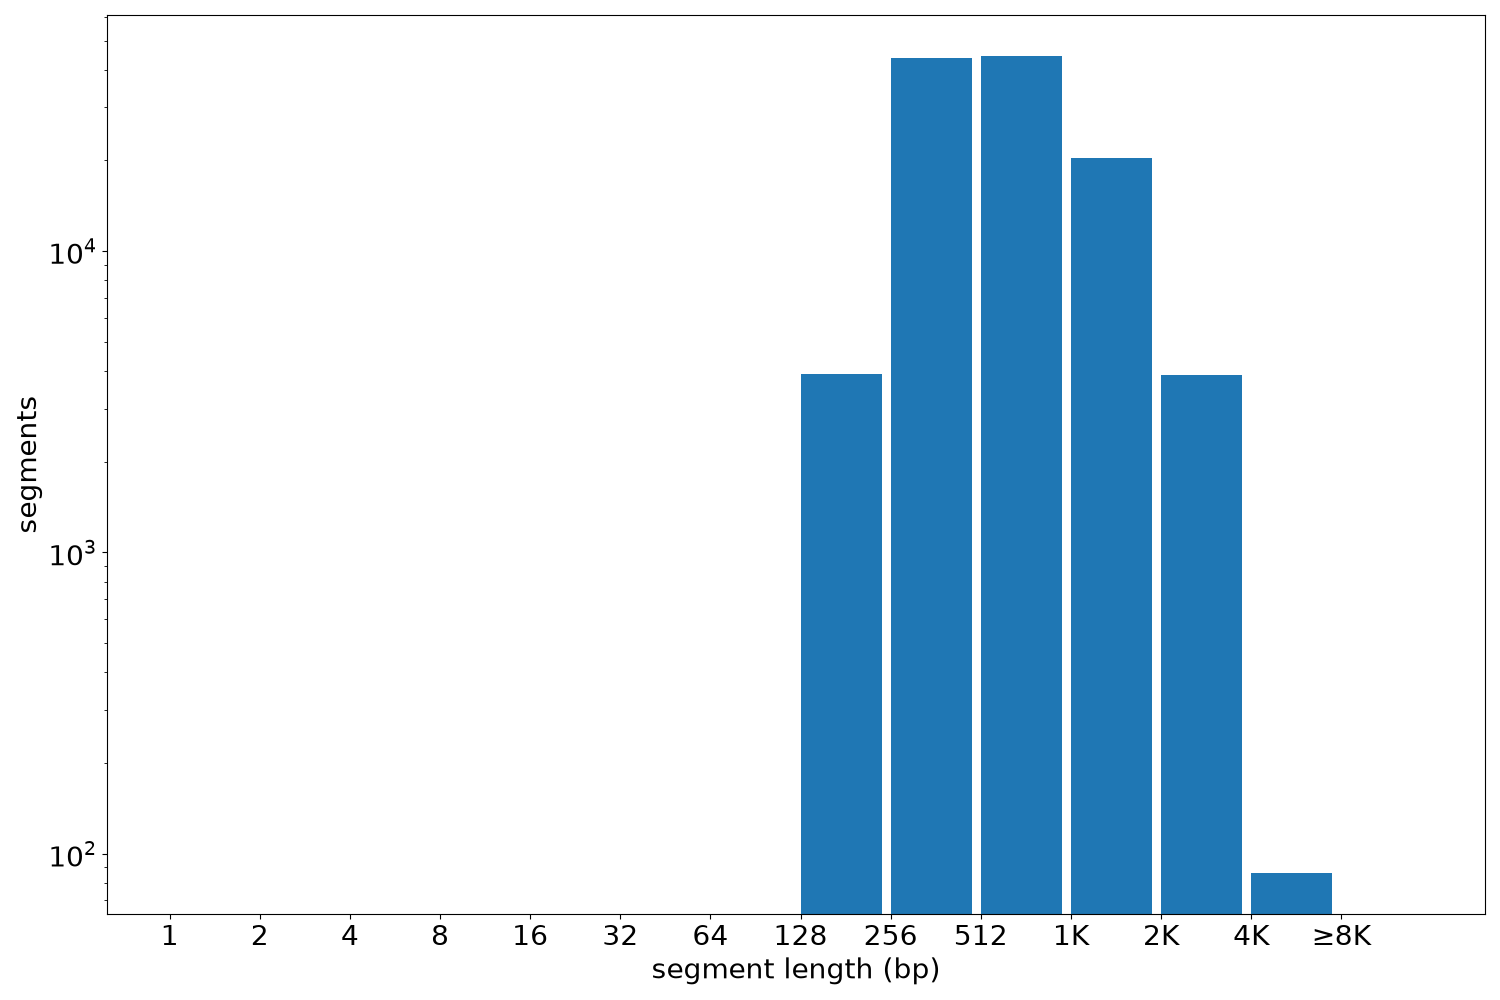
Segment lengths
| segments | min | max | mean | median | |
|---|---|---|---|---|---|
| segments | 116470 | 190 | 7382 | 756.57 | 588 |
Files
| Filename | Size | md5 |
|---|---|---|
| ENCFF706NCG.bed.gz | 2.84 MB | e689393fc5dfd695b34d566342fe4fdb |
| ENCFF706NCG.tabix.bed.gz | 1.23 MB | fe1a65fcf32bfa25f7425f49c4dba5e9 |
| ENCFF706NCG.tabix.bed.gz.tbi | 434.82 KB | 8d2120f8bc70b8cb3b4177f42c09a010 |
| genomic_resource.yaml | 3.11 KB | d790335934e0fba9ad9c6c7590afc0b1 |
| statistics/ |