Resource
| Id | DNase-seq/ENCSR000EQC |
|---|---|
| Type | position_score |
| Version | 0 |
| Summary | DNase-seq ENCSR000EQC [biosample_summary="Homo sapiens T-helper 1 cell"] |
| Description |
status: released biological_replicates: Rep 2 summary: output_type: peaks audit_internal_action: Archived analysis {ENCAN305CDI|/analyses/ENCAN305CDI/} has in progress subobject quality standard {encode3-dnase|/quality-standards/encode3-dnase/} audit_not_compliant: Replicate concordance in DNase-seq experiments is measured by calculating the Pearson correlation between signal quantification of the replicates. ENCODE processed signal files {ENCFF479VHW|/files/ENCFF479VHW/}, {ENCFF148BTW|/files/ENCFF148BTW/} processed by DNase-seq ENCODE3 GRCh38 pipeline ({ENCPL001DNS|/pipelines/ENCPL001DNS/}) for GRCh38 assembly have a Pearson correlation of 0.53. According to ENCODE standards, in an isogenic assay a Pearson correlation value > 0.9 is recommended. (See {ENCODE DNase-seq data standards|/data-standards/dnase-seq/} ) |
| Labels |
|
Scores (1)
| ID | Type | Default annotation | Description | Histogram | Range | Summary |
|---|---|---|---|---|---|---|
| DNase-seq_ENCSR000EQC | float |
DNase-seq_ENCSR000EQC |
DNase-seq ENCSR000EQC [biosample_summary="Homo sapiens T-helper 1 cell"]
|
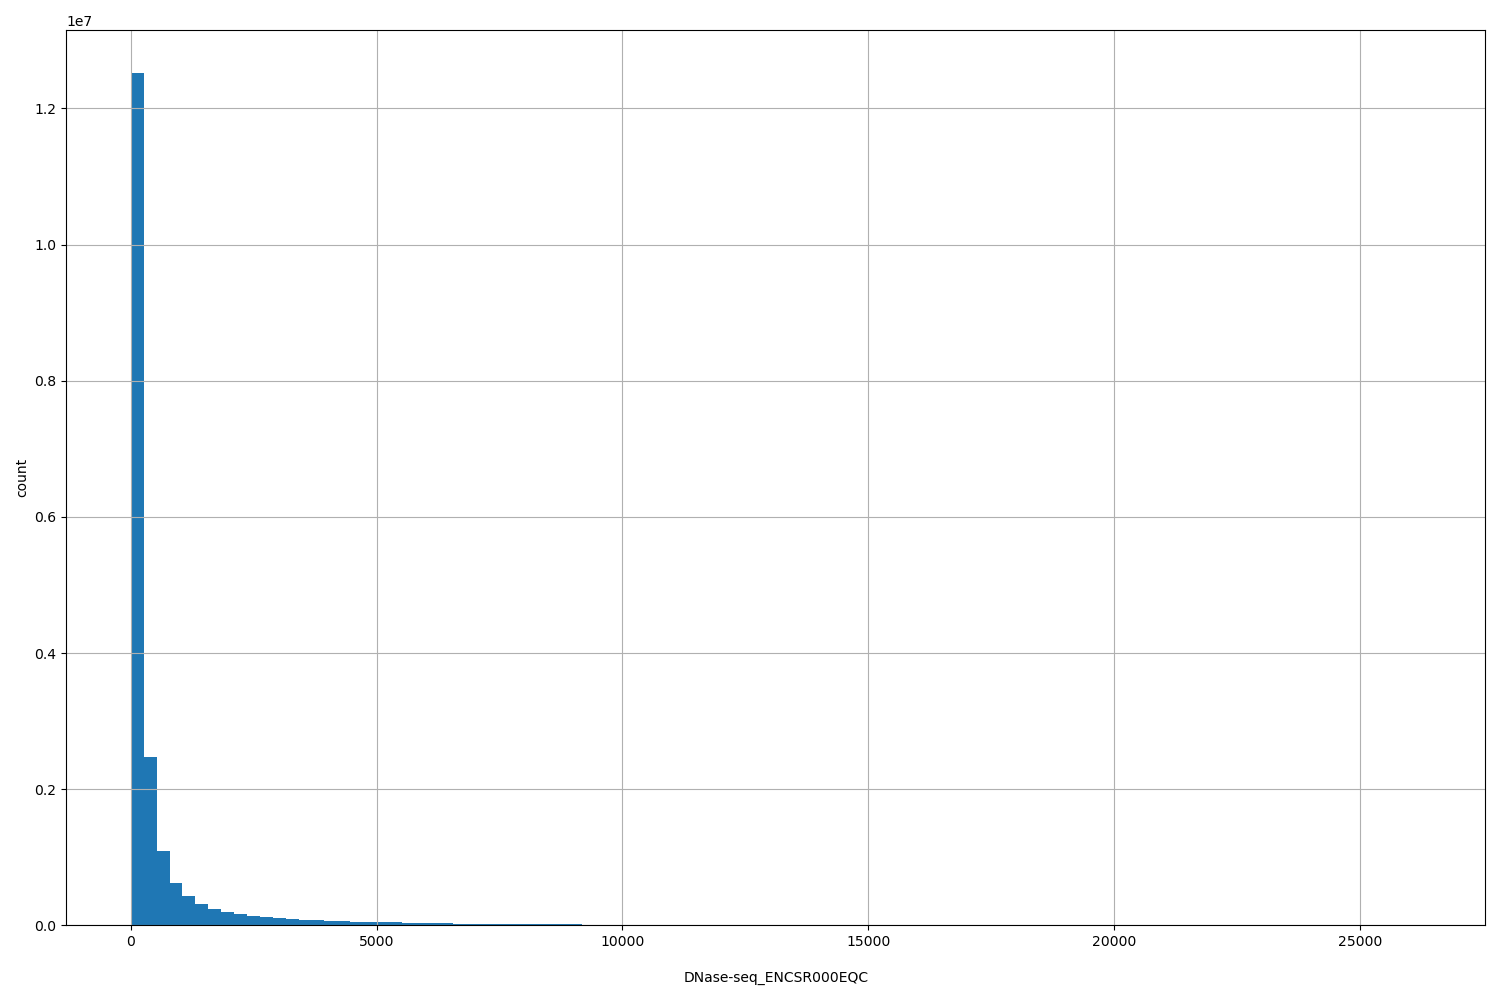 |
[3, 2.62e+04] |
|
n counts base pairs; sd is the population standard deviation.
Coverage
| Chromosome | Covered positions | Covered % | Segments |
|---|---|---|---|
| all chromosomes | 19476765 | 0.61% | 129722 |
| chr1 | 1847378 | 0.74% | 12302 |
| chr2 | 1571931 | 0.65% | 10469 |
| chr3 | 1228577 | 0.62% | 8182 |
| chr4 | 876283 | 0.46% | 5831 |
| chr5 | 1014637 | 0.56% | 6755 |
| chr6 | 1185836 | 0.69% | 7900 |
| chr7 | 941065 | 0.59% | 6266 |
| chr8 | 832755 | 0.57% | 5546 |
| chr9 | 792345 | 0.57% | 5280 |
| chr10 | 892499 | 0.67% | 5945 |
| chr11 | 908045 | 0.67% | 6049 |
| chr12 | 982925 | 0.74% | 6549 |
| chr13 | 490966 | 0.43% | 3271 |
| chr14 | 696135 | 0.65% | 4637 |
| chr15 | 649200 | 0.64% | 4323 |
| chr16 | 663607 | 0.73% | 4422 |
| chr17 | 926156 | 1.11% | 6171 |
| chr18 | 373704 | 0.46% | 2489 |
| chr19 | 777258 | 1.33% | 5178 |
| chr20 | 499950 | 0.78% | 3330 |
| chr21 | 246711 | 0.53% | 1644 |
| chr22 | 377258 | 0.74% | 2515 |
| chrX | 683844 | 0.44% | 4551 |
| chrY | 17700 | 0.03% | 117 |
| 3342 contigs with no values (129077085 bp) | 0 | 0.00% | 0 |
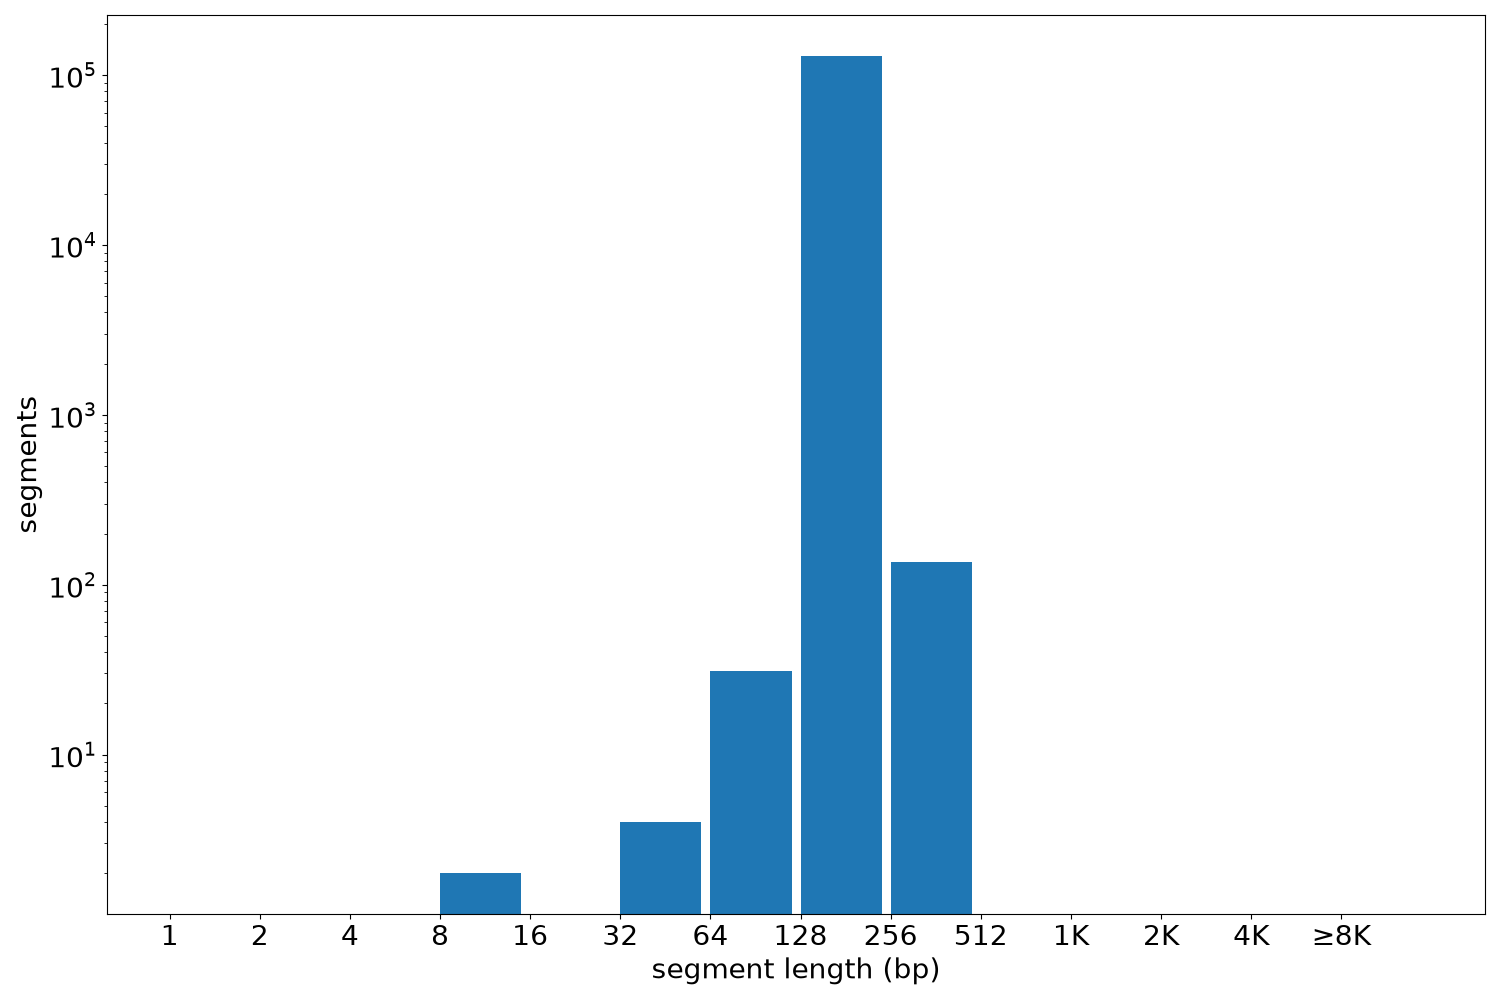
Segment lengths
| segments | min | max | mean | median | |
|---|---|---|---|---|---|
| segments | 129722 | 8 | 429 | 150.14 | 150 |
Files
| Filename | Size | md5 |
|---|---|---|
| ENCFF920ELS.bed.gz | 1.27 MB | d79937a88e830880f8075dc497eb085c |
| ENCFF920ELS.tabix.bed.gz | 1.1 MB | 1f946e01432d289cd60328adee1e676f |
| ENCFF920ELS.tabix.bed.gz.tbi | 465.52 KB | 49af1c946ba5fa47d7dbad97e0bc6860 |
| genomic_resource.yaml | 1.91 KB | e6c1d32640425aa0dc26efbcf3e48b7b |
| statistics/ |