Resource
| Id | TF_ChIP-seq/ENCSR000BOT |
|---|---|
| Type | position_score |
| Version | 0 |
| Summary | TF_ChIP-seq ENCSR000BOT [biosample_summary="Homo sapiens HepG2" and target="REST"] |
| Description |
status: released biological_replicates: Rep 1, Rep 2 summary: output_type: IDR thresholded peaks audit_internal_action: Released analysis {ENCAN099KCF|/analyses/ENCAN099KCF/} has in progress subobject document {fc7197f2-547a-4e91-88fc-d91634f8e82c|/documents/fc7197f2-547a-4e91-88fc-d91634f8e82c/} audit_internal_action: Released analysis {ENCAN099KCF|/analyses/ENCAN099KCF/} has in progress subobject quality standard {encode4-tf-chip|/quality-standards/encode4-tf-chip/} audit_warning: PBC1 (PCR Bottlenecking Coefficient 1, M1/M_distinct) is the ratio of the number of genomic locations where exactly one read maps uniquely (M1) to the number of genomic locations where some reads map (M_distinct). A PBC1 value in the range 0 - 0.5 is severe bottlenecking, 0.5 - 0.8 is moderate bottlenecking, 0.8 - 0.9 is mild bottlenecking, and > 0.9 is no bottlenecking. PBC1 value > 0.9 is recommended, but > 0.8 is acceptable. ENCODE processed alignments file {ENCFF871IQR|/files/ENCFF871IQR/} processed by ChIP-seq ENCODE4 v1.6.1 GRCh38 pipeline was generated from a library with PBC1 value of 0.86. audit_warning: PBC2 (PCR Bottlenecking Coefficient 2, M1/M2) is the ratio of the number of genomic locations where exactly one read maps uniquely (M1) to the number of genomic locations where two reads map uniquely (M2). A PBC2 value in the range 0 - 1 is severe bottlenecking, 1 - 3 is moderate bottlenecking, 3 - 10 is mild bottlenecking, > 10 is no bottlenecking. PBC2 value > 10 is recommended, but > 3 is acceptable. ENCODE processed alignments file {ENCFF871IQR|/files/ENCFF871IQR/} processed by ChIP-seq ENCODE4 v1.6.1 GRCh38 pipeline was generated from a library with PBC2 value of 7.00. audit_warning: PBC1 (PCR Bottlenecking Coefficient 1, M1/M_distinct) is the ratio of the number of genomic locations where exactly one read maps uniquely (M1) to the number of genomic locations where some reads map (M_distinct). A PBC1 value in the range 0 - 0.5 is severe bottlenecking, 0.5 - 0.8 is moderate bottlenecking, 0.8 - 0.9 is mild bottlenecking, and > 0.9 is no bottlenecking. PBC1 value > 0.9 is recommended, but > 0.8 is acceptable. ENCODE processed alignments file {ENCFF111DXX|/files/ENCFF111DXX/} processed by ChIP-seq ENCODE4 v1.6.1 GRCh38 pipeline was generated from a library with PBC1 value of 0.87. audit_warning: PBC2 (PCR Bottlenecking Coefficient 2, M1/M2) is the ratio of the number of genomic locations where exactly one read maps uniquely (M1) to the number of genomic locations where two reads map uniquely (M2). A PBC2 value in the range 0 - 1 is severe bottlenecking, 1 - 3 is moderate bottlenecking, 3 - 10 is mild bottlenecking, > 10 is no bottlenecking. PBC2 value > 10 is recommended, but > 3 is acceptable. ENCODE processed alignments file {ENCFF111DXX|/files/ENCFF111DXX/} processed by ChIP-seq ENCODE4 v1.6.1 GRCh38 pipeline was generated from a library with PBC2 value of 7.64. audit_warning: Replicate concordance in ChIP-seq experiments is measured by calculating IDR values (Irreproducible Discovery Rate). ENCODE processed IDR thresholded peaks files {ENCFF271FEM|/files/ENCFF271FEM/} processed by ChIP-seq ENCODE4 v1.6.1 GRCh38 pipeline have a rescue ratio of 1.43 and a self consistency ratio of 2.33. According to ENCODE standards, having both rescue ratio and self consistency ratio values < 2 is recommended, but having only one of the ratio values < 2 is acceptable. |
| Labels |
|
Scores (1)
| ID | Type | Default annotation | Description | Histogram | Range | Summary |
|---|---|---|---|---|---|---|
| TF_ChIP-seq_ENCSR000BOT | float |
TF_ChIP-seq_ENCSR000BOT |
TF_ChIP-seq ENCSR000BOT [biosample_summary="Homo sapiens HepG2" and target="REST"]
|
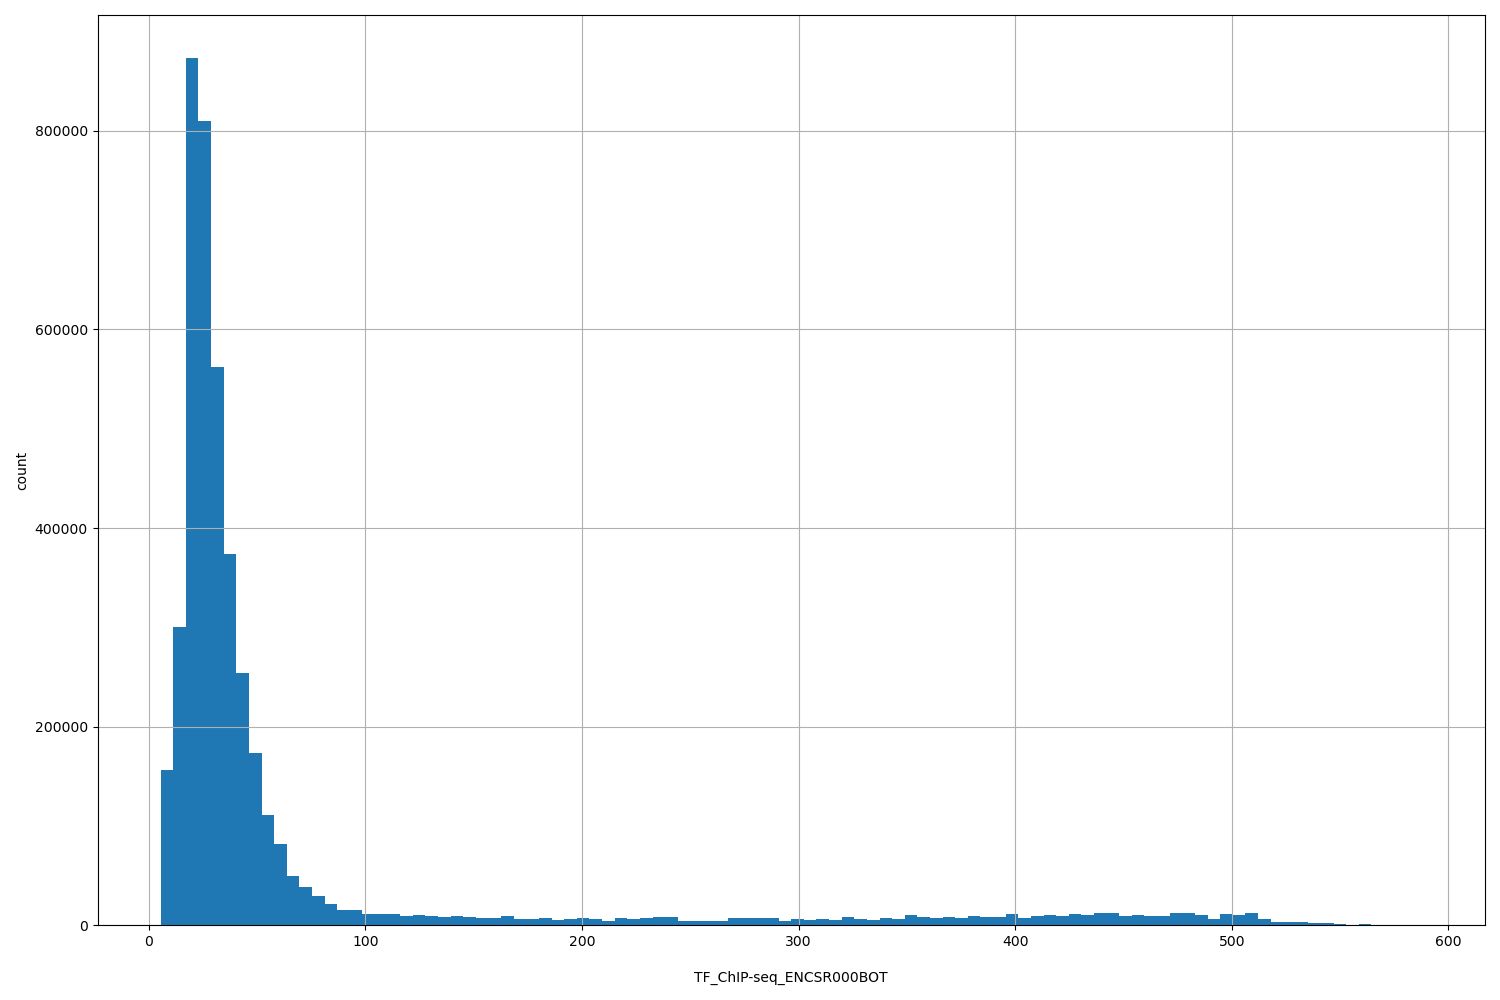 |
[5.42, 588] |
|
n counts base pairs; sd is the population standard deviation.
Coverage
| Chromosome | Covered positions | Covered % | Segments |
|---|---|---|---|
| all chromosomes | 4482505 | 0.14% | 16745 |
| chr1 | 377055 | 0.15% | 1400 |
| chr2 | 501089 | 0.21% | 1900 |
| chr3 | 278394 | 0.14% | 1032 |
| chr4 | 159986 | 0.08% | 606 |
| chr5 | 205204 | 0.11% | 759 |
| chr6 | 328269 | 0.19% | 1226 |
| chr7 | 205897 | 0.13% | 777 |
| chr8 | 175142 | 0.12% | 654 |
| chr9 | 166994 | 0.12% | 622 |
| chr10 | 176187 | 0.13% | 656 |
| chr11 | 196766 | 0.15% | 725 |
| chr12 | 205468 | 0.15% | 779 |
| chr13 | 61855 | 0.05% | 231 |
| chr14 | 164321 | 0.15% | 624 |
| chr15 | 104175 | 0.10% | 398 |
| chr16 | 241191 | 0.27% | 894 |
| chr17 | 283117 | 0.34% | 1052 |
| chr18 | 70781 | 0.09% | 263 |
| chr19 | 188750 | 0.32% | 688 |
| chr20 | 226081 | 0.35% | 837 |
| chr21 | 32548 | 0.07% | 121 |
| chr22 | 81556 | 0.16% | 305 |
| chrX | 50498 | 0.03% | 191 |
| chrY | 1181 | <0.01% | 5 |
| 3342 contigs with no values (129077085 bp) | 0 | 0.00% | 0 |
Segment lengths
| segments | min | max | mean | median | |
|---|---|---|---|---|---|
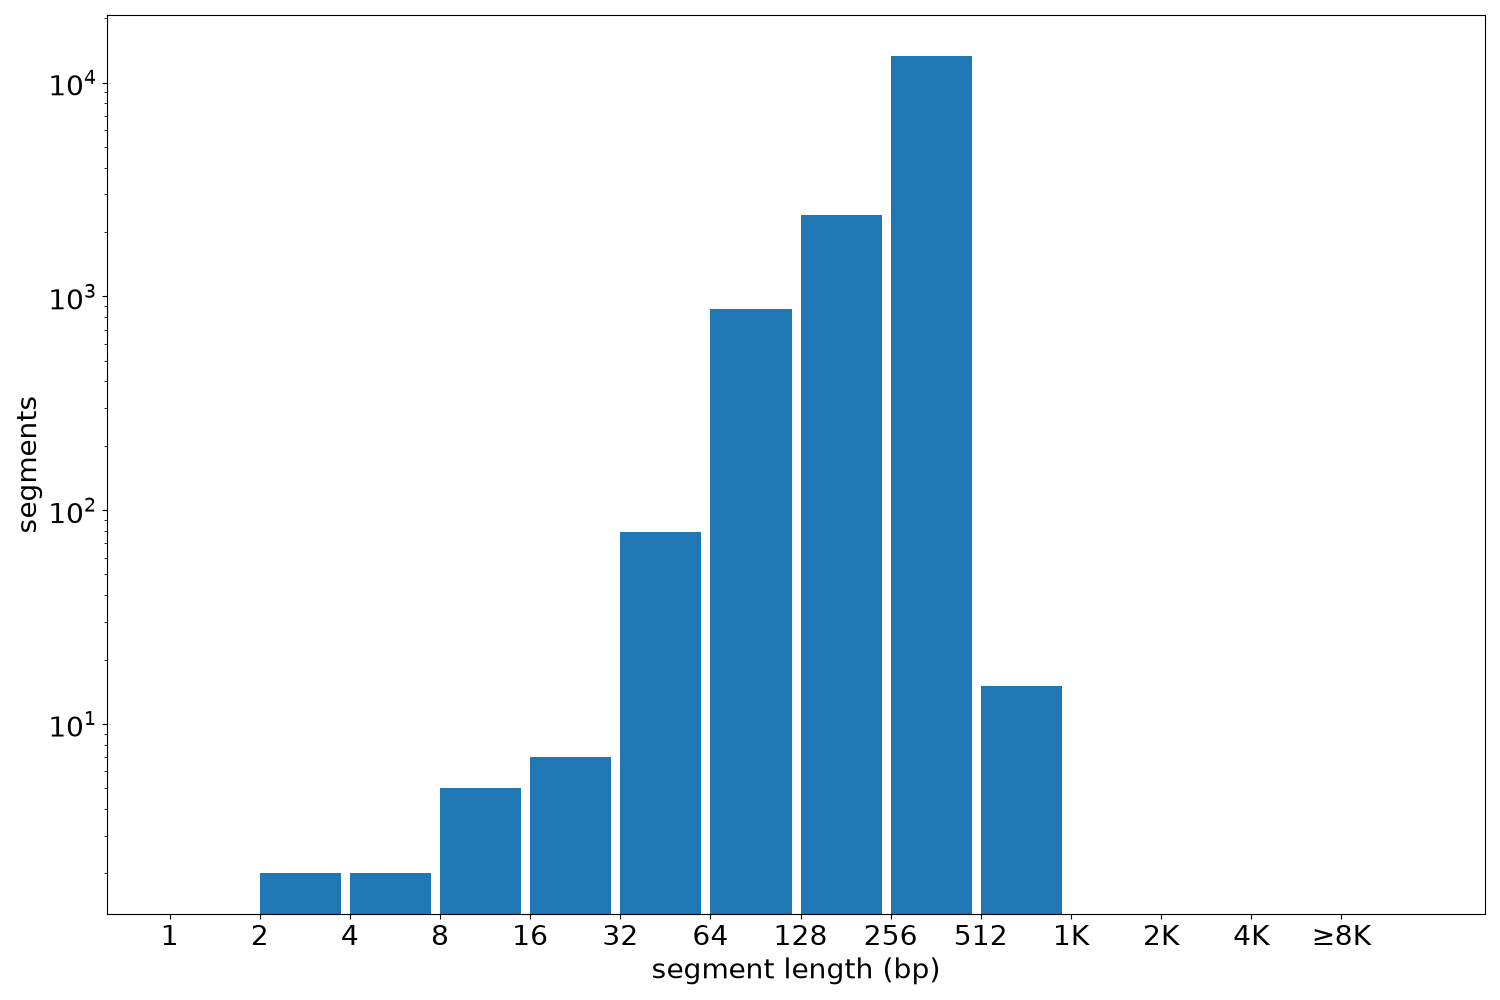
| segments | 16745 | 3 | 741 | 267.69 | 290 |
Files
| Filename | Size | md5 |
|---|---|---|
| ENCFF271FEM.bed.gz | 283.96 KB | e15a8c0d0004642daa8d4a818e760896 |
| ENCFF271FEM.tabix.bed.gz | 195.47 KB | fed79afd7d176ab145e2b26bf7e12aeb |
| ENCFF271FEM.tabix.bed.gz.tbi | 114.21 KB | c55cf88a186b9dc1b6ed805bfd9a9246 |
| genomic_resource.yaml | 4.73 KB | 949e475c1d42e03018f35fb233dfcce2 |
| statistics/ |