Resource
| Id | TF_ChIP-seq/ENCSR000BKQ |
|---|---|
| Type | position_score |
| Version | 0 |
| Summary | TF_ChIP-seq ENCSR000BKQ [biosample_summary="Homo sapiens K562" and target="ETS1"] |
| Description |
status: released biological_replicates: Rep 1, Rep 2 summary: output_type: optimal IDR thresholded peaks audit_internal_action: File {ENCFF461PRP|/files/ENCFF461PRP/} with status 'released' is derived from file {ENCFF419RSJ|/files/ENCFF419RSJ/} with status 'archived'. audit_internal_action: Archived analysis {ENCAN089TUA|/analyses/ENCAN089TUA/} has in progress subobject quality standard {encode3-tf-chip|/quality-standards/encode3-tf-chip/} audit_warning: Processed alignments file {ENCFF401KIO|/files/ENCFF401KIO/} processed by ChIP-seq ENCODE3 GRCh38 pipeline has 12206346 usable fragments. The minimum ENCODE standard for each replicate in a ChIP-seq experiment targeting ETS1-human and investigated as a transcription factor is 10 million usable fragments. The recommended value is > 20 million, but > 10 million is acceptable. (See {ENCODE ChIP-seq data standards|/data-standards/chip-seq/} ) audit_warning: Processed alignments file {ENCFF398SXO|/files/ENCFF398SXO/} processed by ChIP-seq ENCODE3 GRCh38 pipeline has 14461325 usable fragments. The minimum ENCODE standard for each replicate in a ChIP-seq experiment targeting ETS1-human and investigated as a transcription factor is 10 million usable fragments. The recommended value is > 20 million, but > 10 million is acceptable. (See {ENCODE ChIP-seq data standards|/data-standards/chip-seq/} ) audit_warning: PBC1 (PCR Bottlenecking Coefficient 1, M1/M_distinct) is the ratio of the number of genomic locations where exactly one read maps uniquely (M1) to the number of genomic locations where some reads map (M_distinct). A PBC1 value in the range 0 - 0.5 is severe bottlenecking, 0.5 - 0.8 is moderate bottlenecking, 0.8 - 0.9 is mild bottlenecking, and > 0.9 is no bottlenecking. PBC1 value > 0.9 is recommended, but > 0.8 is acceptable. ENCODE processed alignments file {ENCFF401KIO|/files/ENCFF401KIO/} processed by ChIP-seq ENCODE3 GRCh38 pipeline was generated from a library with PBC1 value of 0.88. audit_warning: PBC2 (PCR Bottlenecking Coefficient 2, M1/M2) is the ratio of the number of genomic locations where exactly one read maps uniquely (M1) to the number of genomic locations where two reads map uniquely (M2). A PBC2 value in the range 0 - 1 is severe bottlenecking, 1 - 3 is moderate bottlenecking, 3 - 10 is mild bottlenecking, > 10 is no bottlenecking. PBC2 value > 10 is recommended, but > 3 is acceptable. ENCODE processed alignments file {ENCFF401KIO|/files/ENCFF401KIO/} processed by ChIP-seq ENCODE3 GRCh38 pipeline was generated from a library with PBC2 value of 7.82. audit_warning: PBC1 (PCR Bottlenecking Coefficient 1, M1/M_distinct) is the ratio of the number of genomic locations where exactly one read maps uniquely (M1) to the number of genomic locations where some reads map (M_distinct). A PBC1 value in the range 0 - 0.5 is severe bottlenecking, 0.5 - 0.8 is moderate bottlenecking, 0.8 - 0.9 is mild bottlenecking, and > 0.9 is no bottlenecking. PBC1 value > 0.9 is recommended, but > 0.8 is acceptable. ENCODE processed alignments file {ENCFF398SXO|/files/ENCFF398SXO/} processed by ChIP-seq ENCODE3 GRCh38 pipeline was generated from a library with PBC1 value of 0.84. audit_warning: PBC2 (PCR Bottlenecking Coefficient 2, M1/M2) is the ratio of the number of genomic locations where exactly one read maps uniquely (M1) to the number of genomic locations where two reads map uniquely (M2). A PBC2 value in the range 0 - 1 is severe bottlenecking, 1 - 3 is moderate bottlenecking, 3 - 10 is mild bottlenecking, > 10 is no bottlenecking. PBC2 value > 10 is recommended, but > 3 is acceptable. ENCODE processed alignments file {ENCFF398SXO|/files/ENCFF398SXO/} processed by ChIP-seq ENCODE3 GRCh38 pipeline was generated from a library with PBC2 value of 6.15. |
| Labels |
|
Scores (1)
| ID | Type | Default annotation | Description | Histogram | Range | Summary |
|---|---|---|---|---|---|---|
| TF_ChIP-seq_ENCSR000BKQ | float |
TF_ChIP-seq_ENCSR000BKQ |
TF_ChIP-seq ENCSR000BKQ [biosample_summary="Homo sapiens K562" and target="ETS1"]
|
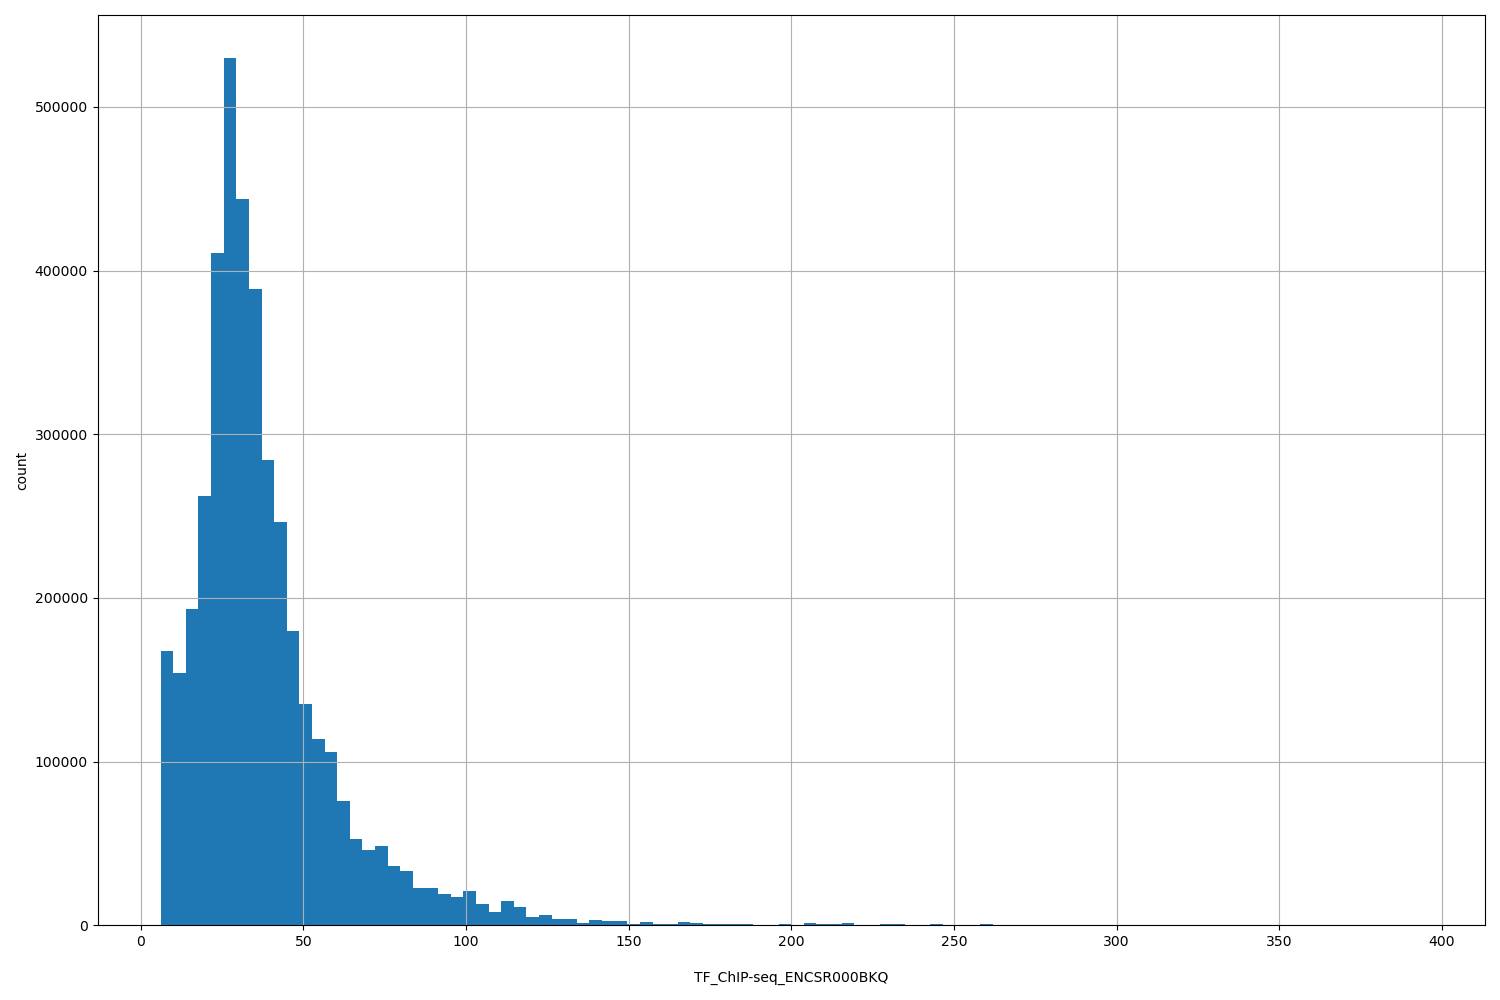 |
[6.07, 394] |
|
n counts base pairs; sd is the population standard deviation.
Coverage
| Chromosome | Covered positions | Covered % | Segments |
|---|---|---|---|
| all chromosomes | 4111085 | 0.13% | 13357 |
| chr1 | 530985 | 0.21% | 1745 |
| chr1_KI270713v1_random | 632 | 1.55% | 3 |
| chr2 | 225296 | 0.09% | 739 |
| chr3 | 202406 | 0.10% | 653 |
| chr4 | 108542 | 0.06% | 355 |
| chr5 | 176193 | 0.10% | 562 |
| chr6 | 300297 | 0.18% | 982 |
| chr7 | 249267 | 0.16% | 821 |
| chr8 | 140476 | 0.10% | 455 |
| chr9 | 145902 | 0.11% | 464 |
| chr10 | 139589 | 0.10% | 449 |
| chr11 | 243515 | 0.18% | 820 |
| chr12 | 194446 | 0.15% | 625 |
| chr13 | 27786 | 0.02% | 83 |
| chr14 | 68289 | 0.06% | 211 |
| chr15 | 126362 | 0.12% | 402 |
| chr16 | 230099 | 0.25% | 763 |
| chr17 | 246454 | 0.30% | 780 |
| chr18 | 40780 | 0.05% | 137 |
| chr19 | 371363 | 0.63% | 1214 |
| chr20 | 99107 | 0.15% | 316 |
| chr21 | 48319 | 0.10% | 163 |
| chr22 | 137608 | 0.27% | 433 |
| chrUn_GL000219v1 | 792 | 0.44% | 2 |
| chrUn_GL000224v1 | 396 | 0.22% | 1 |
| chrX | 56184 | 0.04% | 179 |
| 3340 contigs with no values (185904864 bp) | 0 | 0.00% | 0 |
Segment lengths
| segments | min | max | mean | median | |
|---|---|---|---|---|---|
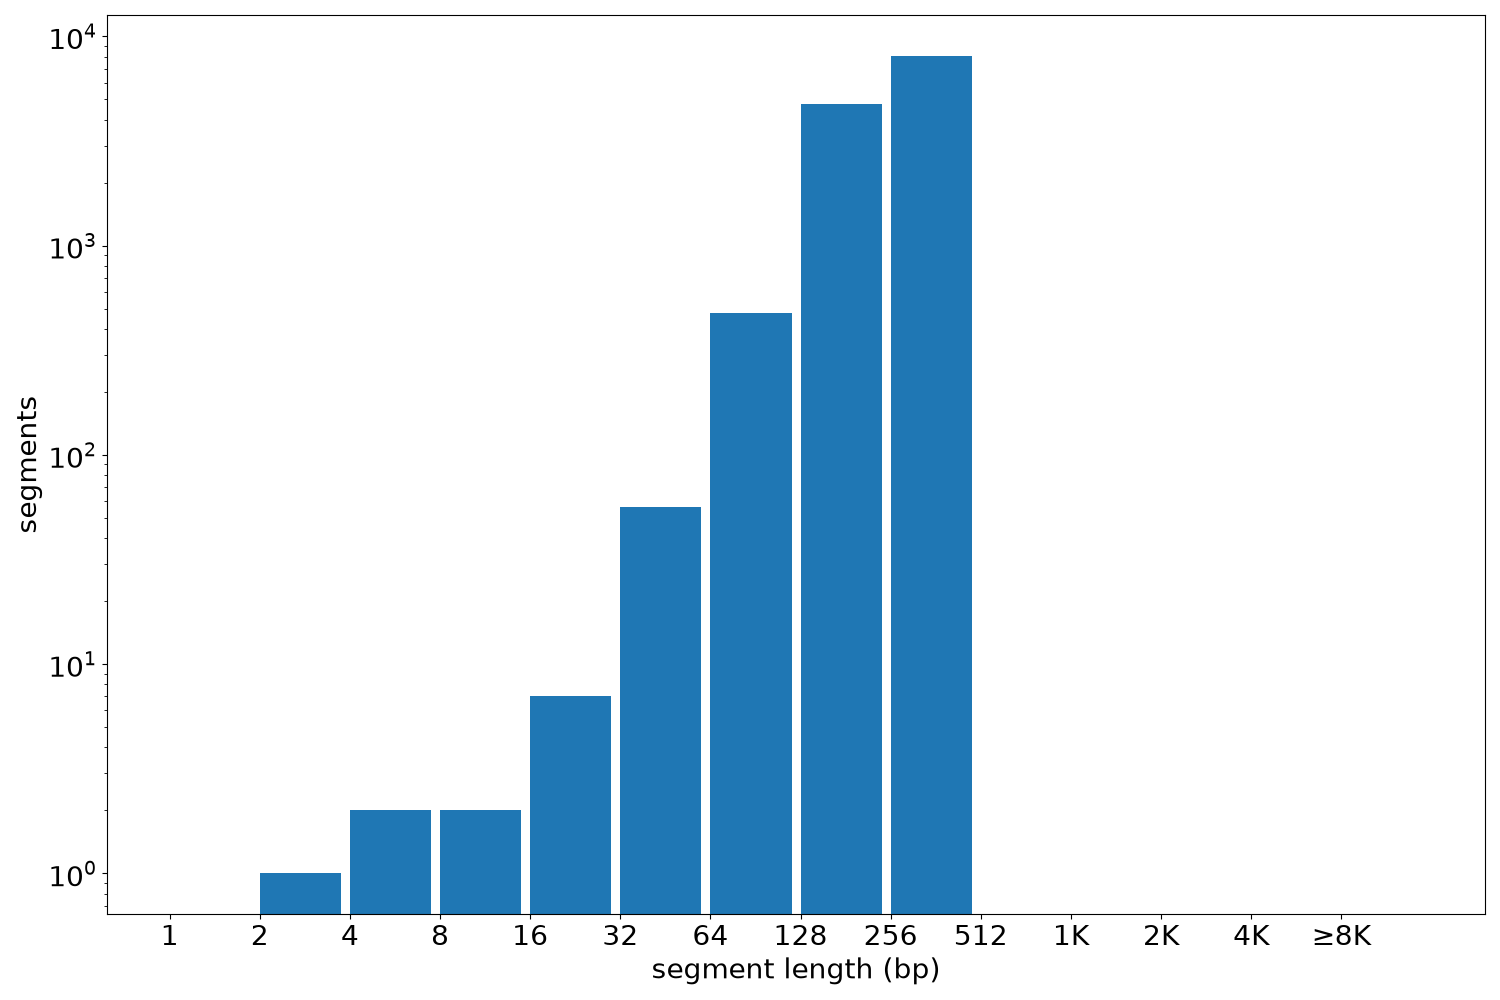
| segments | 13357 | 3 | 396 | 307.79 | 396 |
Files
| Filename | Size | md5 |
|---|---|---|
| ENCFF461PRP.bed.gz | 201.87 KB | 709b8e71866304816aad277c92c8a529 |
| ENCFF461PRP.tabix.bed.gz | 153.26 KB | 7bcb2fa2ce18533643366e0c2c9c0b50 |
| ENCFF461PRP.tabix.bed.gz.tbi | 73.56 KB | b2e750e84c6e5ac9559a20b1ac87f55d |
| genomic_resource.yaml | 5.12 KB | ffd361b04b33e2279f4b2eff929908a6 |
| statistics/ |