Resource
| Id | TF_ChIP-seq/ENCSR000BKK |
|---|---|
| Type | position_score |
| Version | 0 |
| Summary | TF_ChIP-seq ENCSR000BKK [biosample_summary="Homo sapiens H1" and target="EP300"] |
| Description |
status: released biological_replicates: Rep 1, Rep 2 summary: output_type: optimal IDR thresholded peaks audit_internal_action: Archived analysis {ENCAN886QCD|/analyses/ENCAN886QCD/} has in progress subobject quality standard {encode3-tf-chip|/quality-standards/encode3-tf-chip/} audit_warning: Processed alignments file {ENCFF060WKJ|/files/ENCFF060WKJ/} processed by ChIP-seq ENCODE3 hg19 pipeline has 10318720 usable fragments. The minimum ENCODE standard for each replicate in a ChIP-seq experiment targeting EP300-human and investigated as a transcription factor is 10 million usable fragments. The recommended value is > 20 million, but > 10 million is acceptable. (See {ENCODE ChIP-seq data standards|/data-standards/chip-seq/} ) audit_warning: Processed alignments file {ENCFF123VAK|/files/ENCFF123VAK/} processed by ChIP-seq ENCODE3 hg19 pipeline has 17866580 usable fragments. The minimum ENCODE standard for each replicate in a ChIP-seq experiment targeting EP300-human and investigated as a transcription factor is 10 million usable fragments. The recommended value is > 20 million, but > 10 million is acceptable. (See {ENCODE ChIP-seq data standards|/data-standards/chip-seq/} ) audit_warning: PBC1 (PCR Bottlenecking Coefficient 1, M1/M_distinct) is the ratio of the number of genomic locations where exactly one read maps uniquely (M1) to the number of genomic locations where some reads map (M_distinct). A PBC1 value in the range 0 - 0.5 is severe bottlenecking, 0.5 - 0.8 is moderate bottlenecking, 0.8 - 0.9 is mild bottlenecking, and > 0.9 is no bottlenecking. PBC1 value > 0.9 is recommended, but > 0.8 is acceptable. ENCODE processed alignments file {ENCFF060WKJ|/files/ENCFF060WKJ/} processed by ChIP-seq ENCODE3 hg19 pipeline was generated from a library with PBC1 value of 0.86. audit_warning: PBC2 (PCR Bottlenecking Coefficient 2, M1/M2) is the ratio of the number of genomic locations where exactly one read maps uniquely (M1) to the number of genomic locations where two reads map uniquely (M2). A PBC2 value in the range 0 - 1 is severe bottlenecking, 1 - 3 is moderate bottlenecking, 3 - 10 is mild bottlenecking, > 10 is no bottlenecking. PBC2 value > 10 is recommended, but > 3 is acceptable. ENCODE processed alignments file {ENCFF060WKJ|/files/ENCFF060WKJ/} processed by ChIP-seq ENCODE3 hg19 pipeline was generated from a library with PBC2 value of 6.90. audit_warning: Replicate concordance in ChIP-seq experiments is measured by calculating IDR values (Irreproducible Discovery Rate). ENCODE processed IDR thresholded peaks files {ENCFF843SYD|/files/ENCFF843SYD/}, {ENCFF087TMV|/files/ENCFF087TMV/} processed by ChIP-seq ENCODE3 hg19 pipeline have a rescue ratio of 1.46 and a self consistency ratio of 8.16. According to ENCODE standards, having both rescue ratio and self consistency ratio values < 2 is recommended, but having only one of the ratio values < 2 is acceptable. audit_warning: Replicate concordance in ChIP-seq experiments is measured by calculating IDR values (Irreproducible Discovery Rate). ENCODE processed IDR thresholded peaks files {ENCFF872MGS|/files/ENCFF872MGS/}, {ENCFF015SPK|/files/ENCFF015SPK/} processed by ChIP-seq ENCODE3 hg19 pipeline have a rescue ratio of 1.46 and a self consistency ratio of 8.16. According to ENCODE standards, having both rescue ratio and self consistency ratio values < 2 is recommended, but having only one of the ratio values < 2 is acceptable. |
| Labels |
|
Scores (1)
| ID | Type | Default annotation | Description | Histogram | Range | Summary |
|---|---|---|---|---|---|---|
| TF_ChIP-seq_ENCSR000BKK | float |
TF_ChIP-seq_ENCSR000BKK |
TF_ChIP-seq ENCSR000BKK [biosample_summary="Homo sapiens H1" and target="EP300"]
|
 |
[4.65, 288] |
|
n counts base pairs; sd is the population standard deviation.
Coverage
| Chromosome | Covered positions | Covered % | Segments |
|---|---|---|---|
| all chromosomes | 3947536 | 0.12% | 14011 |
| chr1 | 406122 | 0.16% | 1459 |
| chr2 | 286490 | 0.12% | 1014 |
| chr3 | 242928 | 0.12% | 860 |
| chr4 | 161073 | 0.08% | 573 |
| chr5 | 212465 | 0.12% | 754 |
| chr6 | 247080 | 0.14% | 890 |
| chr7 | 217495 | 0.14% | 761 |
| chr8 | 156737 | 0.11% | 552 |
| chr9 | 158857 | 0.11% | 563 |
| chr10 | 176811 | 0.13% | 617 |
| chr11 | 221605 | 0.16% | 789 |
| chr12 | 210155 | 0.16% | 750 |
| chr13 | 94290 | 0.08% | 327 |
| chr14 | 129199 | 0.12% | 449 |
| chr15 | 126450 | 0.12% | 450 |
| chr16 | 141263 | 0.16% | 493 |
| chr17 | 193150 | 0.23% | 687 |
| chr18 | 79296 | 0.10% | 279 |
| chr19 | 202998 | 0.35% | 731 |
| chr20 | 115826 | 0.18% | 418 |
| chr21 | 36655 | 0.08% | 129 |
| chr22 | 69625 | 0.14% | 246 |
| chrX | 60066 | 0.04% | 217 |
| chrY | 900 | <0.01% | 3 |
| 3342 contigs with no values (129077085 bp) | 0 | 0.00% | 0 |
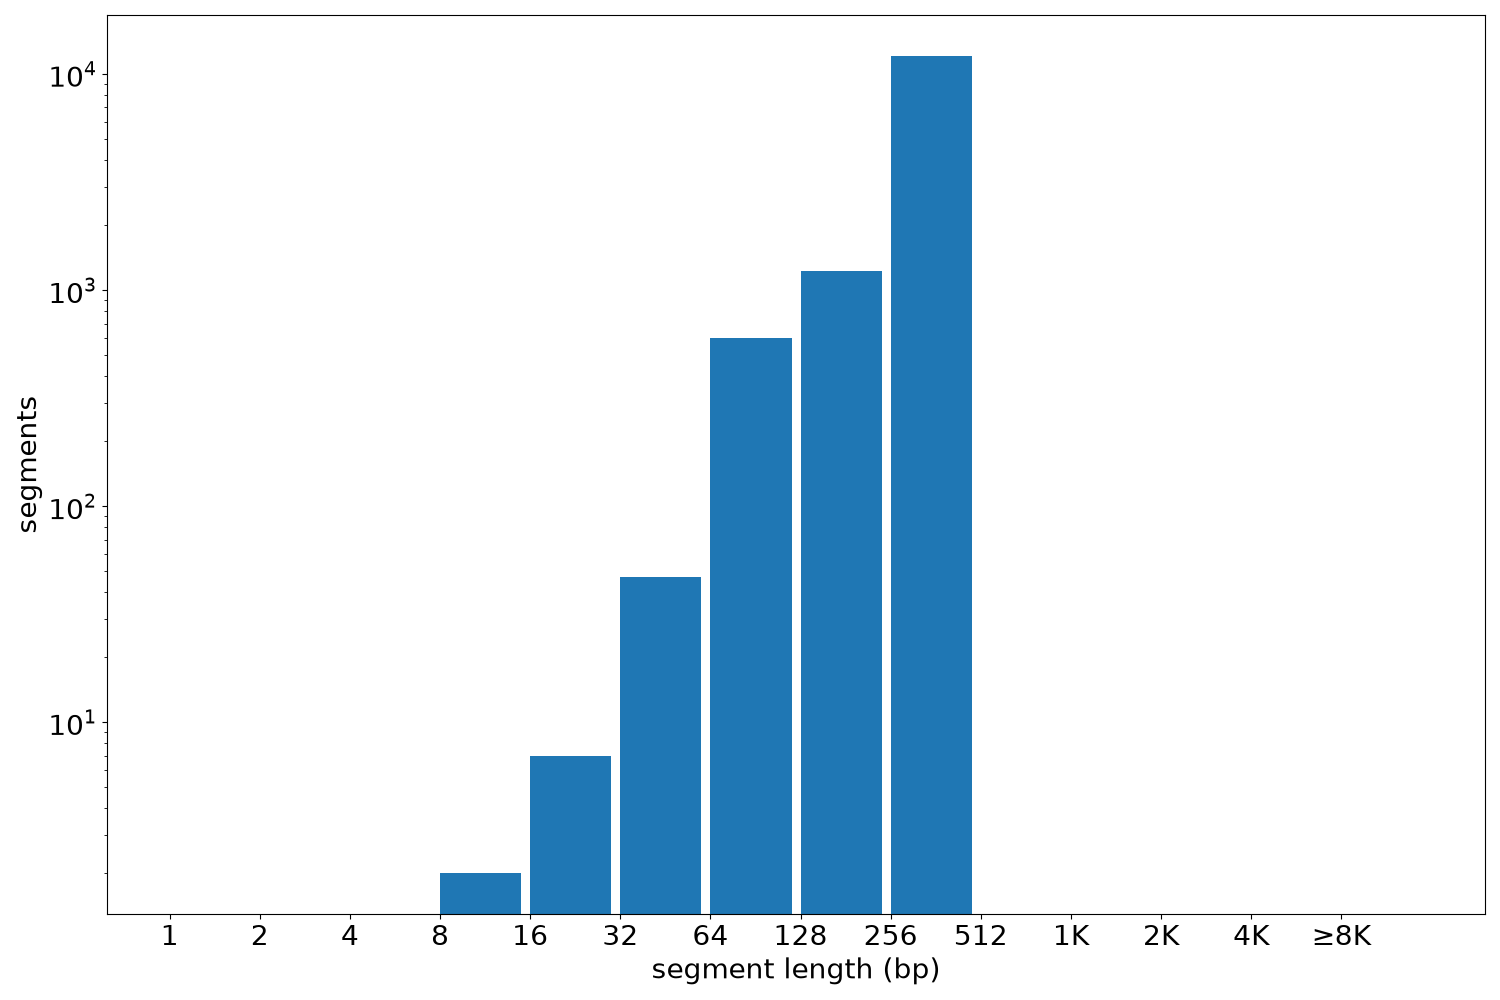
Segment lengths
| segments | min | max | mean | median | |
|---|---|---|---|---|---|
| segments | 14011 | 11 | 372 | 281.75 | 300 |
Files
| Filename | Size | md5 |
|---|---|---|
| ENCFF843SYD.bed.gz | 235.97 KB | c06ac8027f55d91b669cebbc14184c53 |
| ENCFF843SYD.tabix.bed.gz | 162.88 KB | 99a499656a74972c144559c2b762b0a6 |
| ENCFF843SYD.tabix.bed.gz.tbi | 105.96 KB | 43d50d732f9509477695b62500a623a6 |
| genomic_resource.yaml | 4.76 KB | 2bb4d5f86b385751d98e6b767b6212a8 |
| statistics/ |