Resource
| Id | TF_ChIP-seq/ENCSR000BJN |
|---|---|
| Type | position_score |
| Version | 0 |
| Summary | TF_ChIP-seq ENCSR000BJN [biosample_summary="Homo sapiens HepG2" and target="TAF1"] |
| Description |
status: released biological_replicates: Rep 1, Rep 2 summary: output_type: IDR thresholded peaks audit_internal_action: Released analysis {ENCAN732UEB|/analyses/ENCAN732UEB/} has in progress subobject document {26a4534b-0e23-4d1a-9cd3-8221d2673f62|/documents/26a4534b-0e23-4d1a-9cd3-8221d2673f62/} audit_internal_action: Released analysis {ENCAN732UEB|/analyses/ENCAN732UEB/} has in progress subobject quality standard {encode4-tf-chip|/quality-standards/encode4-tf-chip/} audit_warning: Processed alignments file {ENCFF580XZO|/files/ENCFF580XZO/} processed by ChIP-seq ENCODE4 v1.6.1 GRCh38 pipeline has 14523286 usable fragments. The minimum ENCODE standard for each replicate in a ChIP-seq experiment targeting TAF1-human and investigated as a transcription factor is 10 million usable fragments. The recommended value is > 20 million, but > 10 million is acceptable. (See {ENCODE ChIP-seq data standards|/data-standards/chip-seq/} ) audit_warning: Processed alignments file {ENCFF209JAF|/files/ENCFF209JAF/} processed by ChIP-seq ENCODE4 v1.6.1 GRCh38 pipeline has 12703337 usable fragments. The minimum ENCODE standard for each replicate in a ChIP-seq experiment targeting TAF1-human and investigated as a transcription factor is 10 million usable fragments. The recommended value is > 20 million, but > 10 million is acceptable. (See {ENCODE ChIP-seq data standards|/data-standards/chip-seq/} ) audit_warning: PBC1 (PCR Bottlenecking Coefficient 1, M1/M_distinct) is the ratio of the number of genomic locations where exactly one read maps uniquely (M1) to the number of genomic locations where some reads map (M_distinct). A PBC1 value in the range 0 - 0.5 is severe bottlenecking, 0.5 - 0.8 is moderate bottlenecking, 0.8 - 0.9 is mild bottlenecking, and > 0.9 is no bottlenecking. PBC1 value > 0.9 is recommended, but > 0.8 is acceptable. ENCODE processed alignments file {ENCFF580XZO|/files/ENCFF580XZO/} processed by ChIP-seq ENCODE4 v1.6.1 GRCh38 pipeline was generated from a library with PBC1 value of 0.89. audit_warning: PBC2 (PCR Bottlenecking Coefficient 2, M1/M2) is the ratio of the number of genomic locations where exactly one read maps uniquely (M1) to the number of genomic locations where two reads map uniquely (M2). A PBC2 value in the range 0 - 1 is severe bottlenecking, 1 - 3 is moderate bottlenecking, 3 - 10 is mild bottlenecking, > 10 is no bottlenecking. PBC2 value > 10 is recommended, but > 3 is acceptable. ENCODE processed alignments file {ENCFF580XZO|/files/ENCFF580XZO/} processed by ChIP-seq ENCODE4 v1.6.1 GRCh38 pipeline was generated from a library with PBC2 value of 9.18. audit_warning: PBC1 (PCR Bottlenecking Coefficient 1, M1/M_distinct) is the ratio of the number of genomic locations where exactly one read maps uniquely (M1) to the number of genomic locations where some reads map (M_distinct). A PBC1 value in the range 0 - 0.5 is severe bottlenecking, 0.5 - 0.8 is moderate bottlenecking, 0.8 - 0.9 is mild bottlenecking, and > 0.9 is no bottlenecking. PBC1 value > 0.9 is recommended, but > 0.8 is acceptable. ENCODE processed alignments file {ENCFF209JAF|/files/ENCFF209JAF/} processed by ChIP-seq ENCODE4 v1.6.1 GRCh38 pipeline was generated from a library with PBC1 value of 0.84. audit_warning: PBC2 (PCR Bottlenecking Coefficient 2, M1/M2) is the ratio of the number of genomic locations where exactly one read maps uniquely (M1) to the number of genomic locations where two reads map uniquely (M2). A PBC2 value in the range 0 - 1 is severe bottlenecking, 1 - 3 is moderate bottlenecking, 3 - 10 is mild bottlenecking, > 10 is no bottlenecking. PBC2 value > 10 is recommended, but > 3 is acceptable. ENCODE processed alignments file {ENCFF209JAF|/files/ENCFF209JAF/} processed by ChIP-seq ENCODE4 v1.6.1 GRCh38 pipeline was generated from a library with PBC2 value of 6.19. |
| Labels |
|
Scores (1)
| ID | Type | Default annotation | Description | Histogram | Range | Summary |
|---|---|---|---|---|---|---|
| TF_ChIP-seq_ENCSR000BJN | float |
TF_ChIP-seq_ENCSR000BJN |
TF_ChIP-seq ENCSR000BJN [biosample_summary="Homo sapiens HepG2" and target="TAF1"]
|
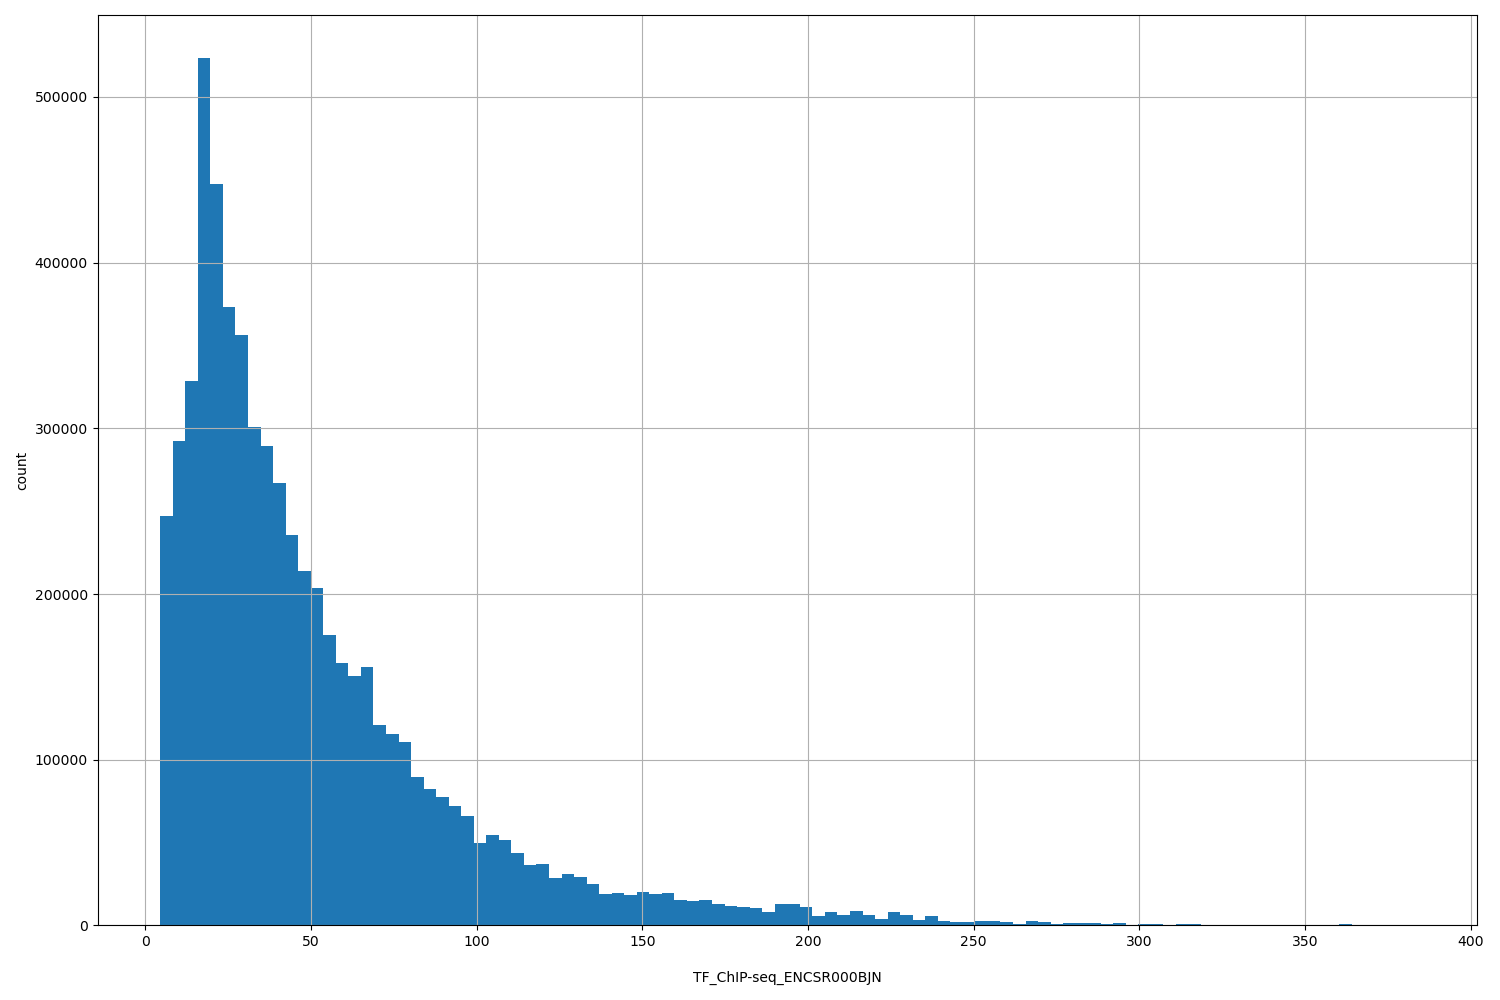 |
[4.47, 383] |
|
n counts base pairs; sd is the population standard deviation.
Coverage
| Chromosome | Covered positions | Covered % | Segments |
|---|---|---|---|
| all chromosomes | 6185874 | 0.19% | 20820 |
| chr1 | 583325 | 0.23% | 1920 |
| chr2 | 458407 | 0.19% | 1613 |
| chr3 | 306193 | 0.15% | 1014 |
| chr4 | 168719 | 0.09% | 557 |
| chr5 | 232470 | 0.13% | 795 |
| chr6 | 314812 | 0.18% | 1084 |
| chr7 | 265805 | 0.17% | 889 |
| chr8 | 192842 | 0.13% | 677 |
| chr9 | 216826 | 0.16% | 744 |
| chr10 | 247308 | 0.18% | 848 |
| chr11 | 292629 | 0.22% | 999 |
| chr12 | 306315 | 0.23% | 1046 |
| chr13 | 105177 | 0.09% | 361 |
| chr14 | 195285 | 0.18% | 654 |
| chr15 | 195572 | 0.19% | 658 |
| chr16 | 357068 | 0.40% | 1202 |
| chr17 | 491106 | 0.59% | 1658 |
| chr18 | 94237 | 0.12% | 315 |
| chr19 | 530525 | 0.91% | 1736 |
| chr20 | 267523 | 0.42% | 896 |
| chr21 | 52928 | 0.11% | 178 |
| chr22 | 185373 | 0.36% | 597 |
| chrX | 124557 | 0.08% | 377 |
| chrY | 872 | <0.01% | 2 |
| 3342 contigs with no values (129077085 bp) | 0 | 0.00% | 0 |
Segment lengths
| segments | min | max | mean | median | |
|---|---|---|---|---|---|
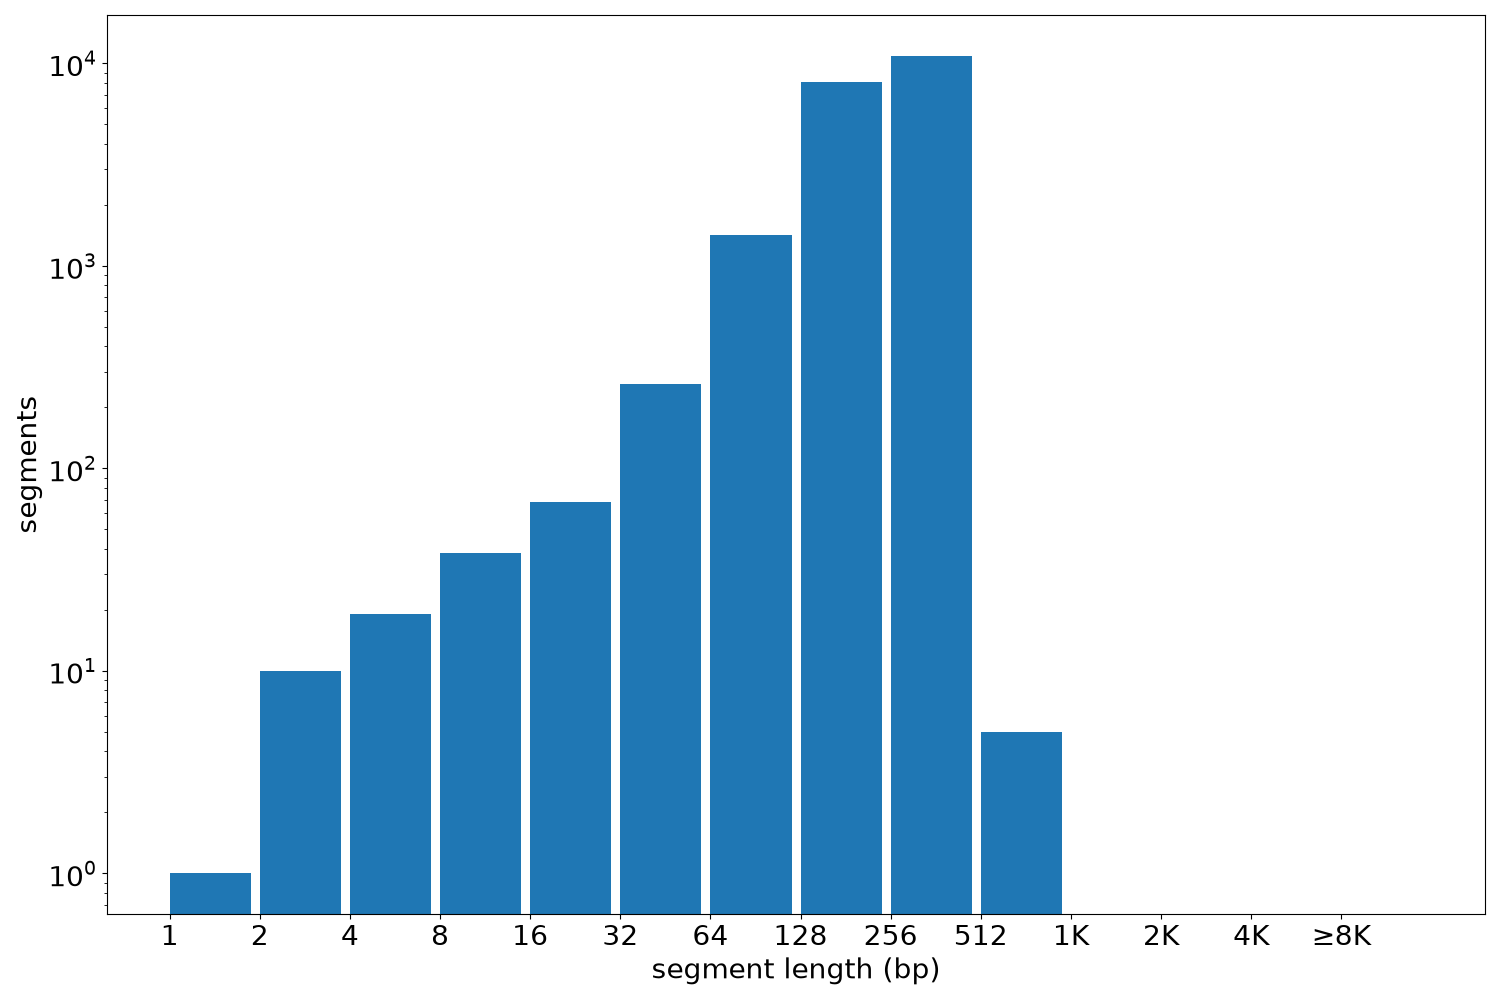
| segments | 20820 | 1 | 635 | 297.11 | 268 |
Files
| Filename | Size | md5 |
|---|---|---|
| ENCFF032ZPF.bed.gz | 296.11 KB | 2989a8fd81ab6babd10fa92324a11abf |
| ENCFF032ZPF.tabix.bed.gz | 237.91 KB | db0c671ae5793eb9a5a490c33305805e |
| ENCFF032ZPF.tabix.bed.gz.tbi | 99.18 KB | 9baf7f237f1dfdf1a8941549b6936ef4 |
| genomic_resource.yaml | 5.19 KB | 0b1e56745c3eaaad58d6945fa8233127 |
| statistics/ |