Resource
| Id | TF_ChIP-seq/ENCSR000BHU |
|---|---|
| Type | position_score |
| Version | 0 |
| Summary | TF_ChIP-seq ENCSR000BHU [biosample_summary="Homo sapiens HepG2" and target="RXRA"] |
| Description |
status: released biological_replicates: Rep 1, Rep 2 summary: output_type: optimal IDR thresholded peaks audit_internal_action: Archived analysis {ENCAN964FSC|/analyses/ENCAN964FSC/} has in progress subobject quality standard {encode3-tf-chip|/quality-standards/encode3-tf-chip/} audit_not_compliant: Replicate concordance in ChIP-seq experiments is measured by calculating IDR values (Irreproducible Discovery Rate). ENCODE processed IDR thresholded peaks files {ENCFF799DNN|/files/ENCFF799DNN/}, {ENCFF964JXI|/files/ENCFF964JXI/} processed by ChIP-seq ENCODE3 hg19 pipeline have a rescue ratio of 2.11 and a self consistency ratio of 5.72. According to ENCODE standards, having both rescue ratio and self consistency ratio values < 2 is recommended, but having only one of the ratio values < 2 is acceptable. audit_not_compliant: Replicate concordance in ChIP-seq experiments is measured by calculating IDR values (Irreproducible Discovery Rate). ENCODE processed IDR thresholded peaks files {ENCFF145AUL|/files/ENCFF145AUL/}, {ENCFF071UJQ|/files/ENCFF071UJQ/} processed by ChIP-seq ENCODE3 hg19 pipeline have a rescue ratio of 2.11 and a self consistency ratio of 5.72. According to ENCODE standards, having both rescue ratio and self consistency ratio values < 2 is recommended, but having only one of the ratio values < 2 is acceptable. audit_warning: Processed alignments file {ENCFF881TVG|/files/ENCFF881TVG/} processed by ChIP-seq ENCODE3 hg19 pipeline has 10305695 usable fragments. The minimum ENCODE standard for each replicate in a ChIP-seq experiment targeting RXRA-human and investigated as a transcription factor is 10 million usable fragments. The recommended value is > 20 million, but > 10 million is acceptable. (See {ENCODE ChIP-seq data standards|/data-standards/chip-seq/} ) audit_warning: PBC1 (PCR Bottlenecking Coefficient 1, M1/M_distinct) is the ratio of the number of genomic locations where exactly one read maps uniquely (M1) to the number of genomic locations where some reads map (M_distinct). A PBC1 value in the range 0 - 0.5 is severe bottlenecking, 0.5 - 0.8 is moderate bottlenecking, 0.8 - 0.9 is mild bottlenecking, and > 0.9 is no bottlenecking. PBC1 value > 0.9 is recommended, but > 0.8 is acceptable. ENCODE processed alignments file {ENCFF881TVG|/files/ENCFF881TVG/} processed by ChIP-seq ENCODE3 hg19 pipeline was generated from a library with PBC1 value of 0.84. audit_warning: PBC2 (PCR Bottlenecking Coefficient 2, M1/M2) is the ratio of the number of genomic locations where exactly one read maps uniquely (M1) to the number of genomic locations where two reads map uniquely (M2). A PBC2 value in the range 0 - 1 is severe bottlenecking, 1 - 3 is moderate bottlenecking, 3 - 10 is mild bottlenecking, > 10 is no bottlenecking. PBC2 value > 10 is recommended, but > 3 is acceptable. ENCODE processed alignments file {ENCFF881TVG|/files/ENCFF881TVG/} processed by ChIP-seq ENCODE3 hg19 pipeline was generated from a library with PBC2 value of 6.23. |
| Labels |
|
Scores (1)
| ID | Type | Default annotation | Description | Histogram | Range | Summary |
|---|---|---|---|---|---|---|
| TF_ChIP-seq_ENCSR000BHU | float |
TF_ChIP-seq_ENCSR000BHU |
TF_ChIP-seq ENCSR000BHU [biosample_summary="Homo sapiens HepG2" and target="RXRA"]
|
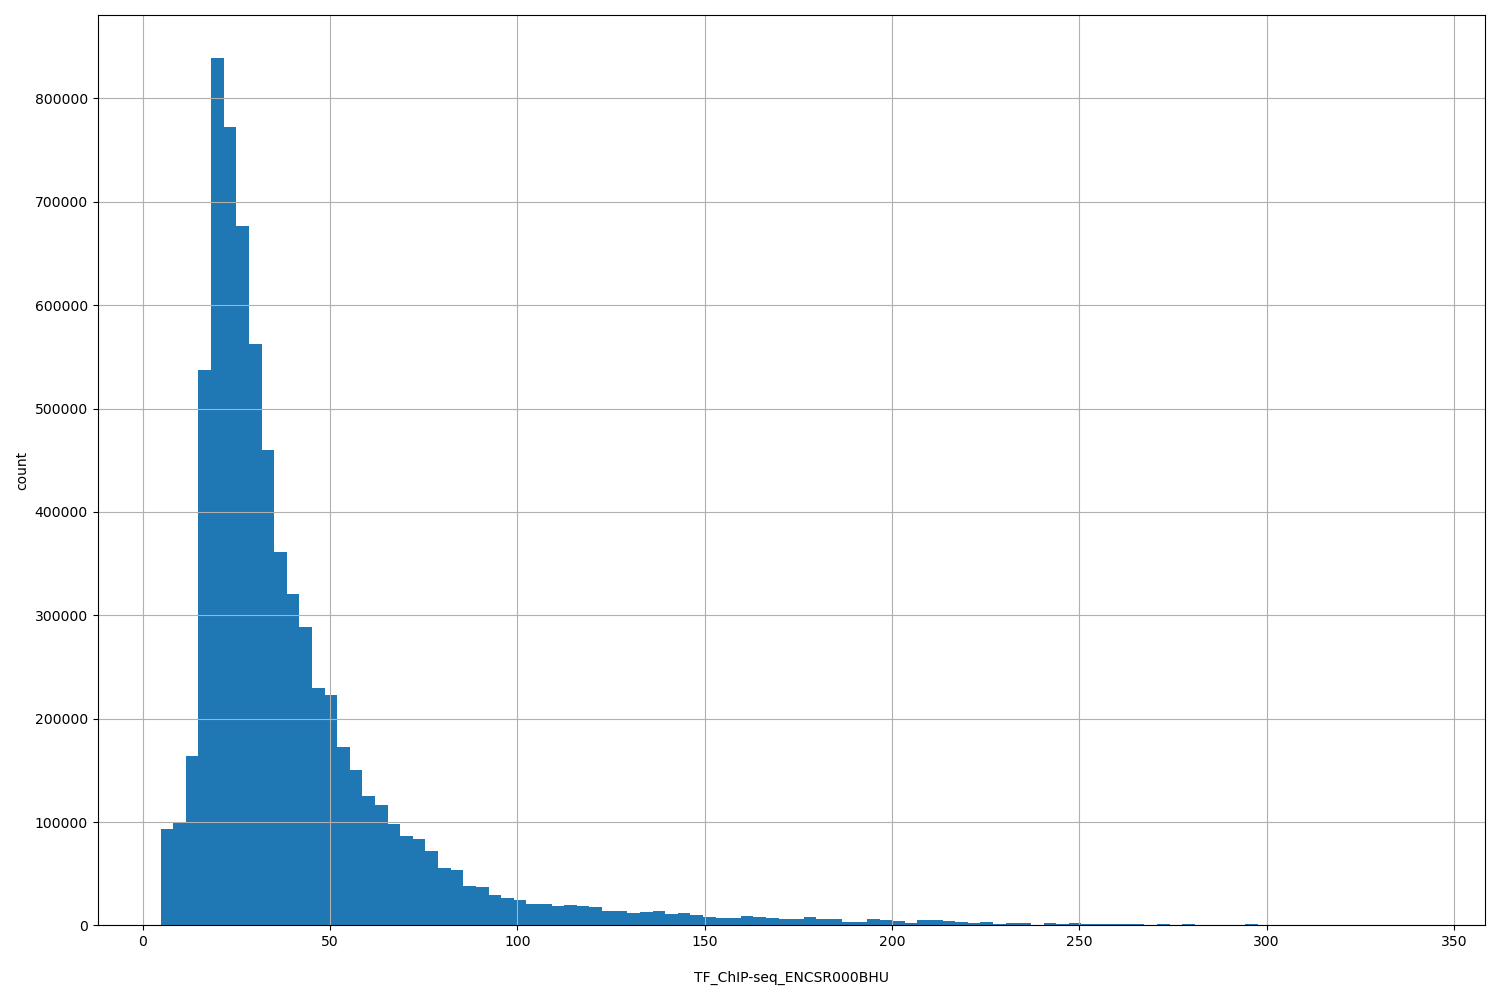 |
[4.79, 341] |
|
n counts base pairs; sd is the population standard deviation.
Coverage
| Chromosome | Covered positions | Covered % | Segments |
|---|---|---|---|
| all chromosomes | 7169937 | 0.22% | 26377 |
| chr1 | 646474 | 0.26% | 2375 |
| chr2 | 728826 | 0.30% | 2674 |
| chr3 | 405611 | 0.20% | 1499 |
| chr4 | 214908 | 0.11% | 793 |
| chr5 | 290109 | 0.16% | 1061 |
| chr6 | 501082 | 0.29% | 1865 |
| chr7 | 303441 | 0.19% | 1107 |
| chr8 | 258619 | 0.18% | 945 |
| chr9 | 277699 | 0.20% | 1017 |
| chr10 | 311446 | 0.23% | 1142 |
| chr11 | 312641 | 0.23% | 1139 |
| chr12 | 295432 | 0.22% | 1101 |
| chr13 | 134891 | 0.12% | 485 |
| chr14 | 276940 | 0.26% | 1017 |
| chr15 | 191957 | 0.19% | 710 |
| chr16 | 388102 | 0.43% | 1434 |
| chr17 | 485024 | 0.58% | 1786 |
| chr18 | 137392 | 0.17% | 503 |
| chr19 | 280027 | 0.48% | 1032 |
| chr20 | 365060 | 0.57% | 1362 |
| chr21 | 81451 | 0.17% | 299 |
| chr22 | 171029 | 0.34% | 617 |
| chrX | 110888 | 0.07% | 411 |
| chrY | 888 | <0.01% | 3 |
| 3342 contigs with no values (129077085 bp) | 0 | 0.00% | 0 |
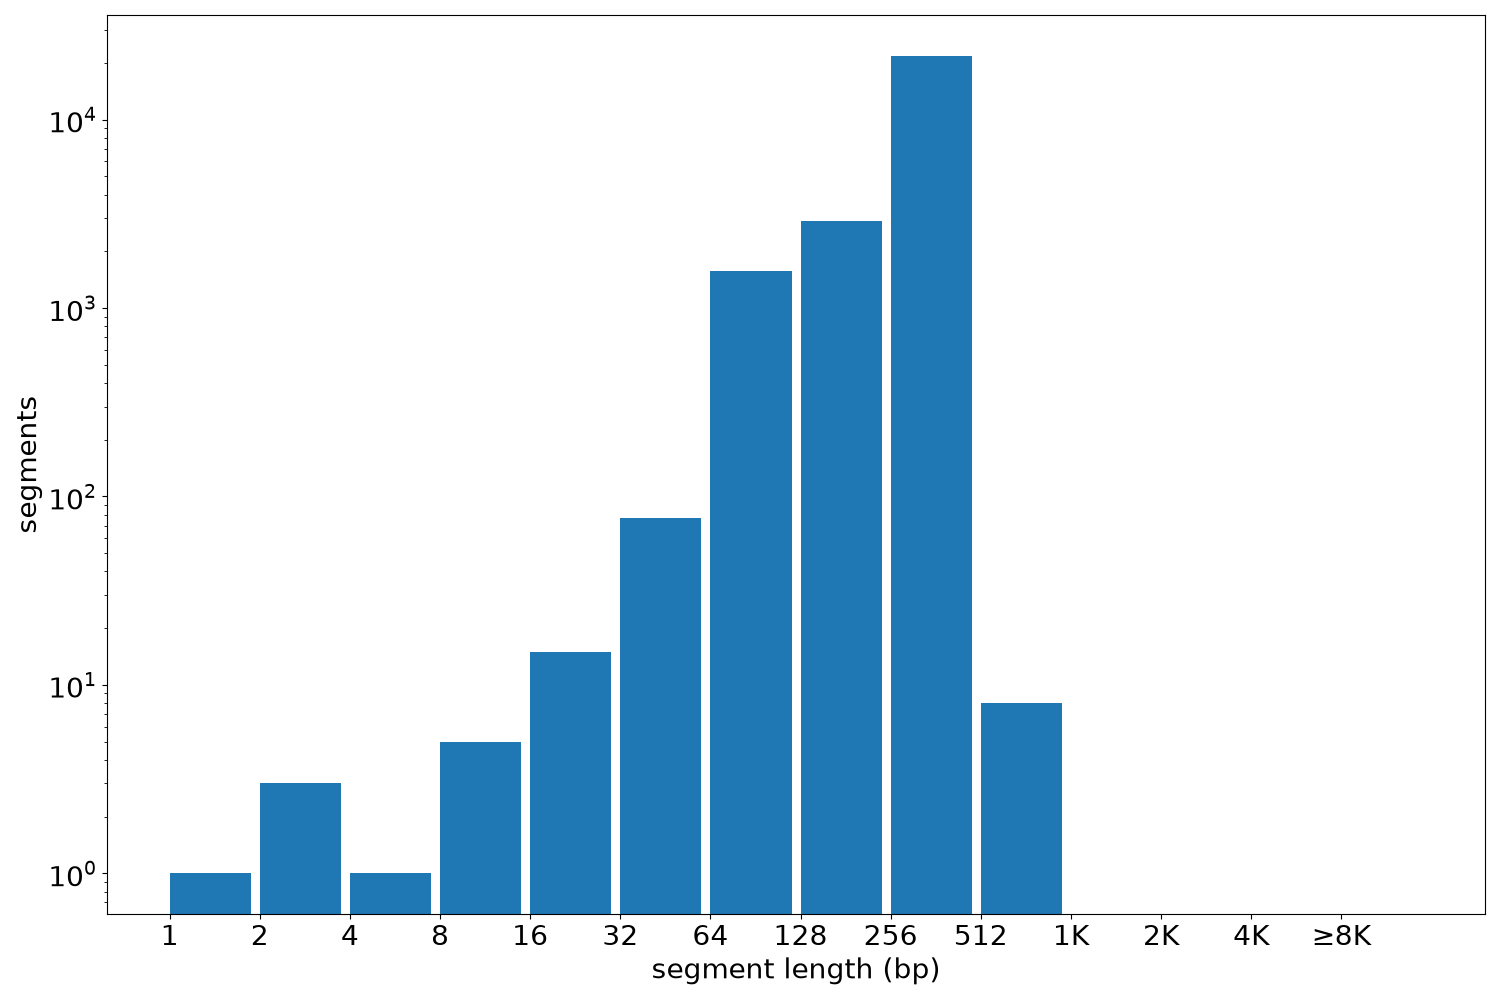
Segment lengths
| segments | min | max | mean | median | |
|---|---|---|---|---|---|
| segments | 26377 | 1 | 711 | 271.83 | 296 |
Files
| Filename | Size | md5 |
|---|---|---|
| ENCFF964JXI.bed.gz | 415.35 KB | d540c903680e4b4ac7aea04e684324a5 |
| ENCFF964JXI.tabix.bed.gz | 305.37 KB | a4f56a3753ff61289822f4be314de30f |
| ENCFF964JXI.tabix.bed.gz.tbi | 151.17 KB | 666c46f68a8d71de8041696b8b2b53ad |
| genomic_resource.yaml | 4.28 KB | 9ee1cac4f468f8c39c68b18f6df685dc |
| statistics/ |