Resource
| Id | TF_ChIP-seq/ENCSR000BGS |
|---|---|
| Type | position_score |
| Version | 0 |
| Summary | TF_ChIP-seq ENCSR000BGS [biosample_summary="Homo sapiens GM12878" and target="TAF1"] |
| Description |
status: released biological_replicates: Rep 1, Rep 2 summary: output_type: IDR thresholded peaks audit_internal_action: Released analysis {ENCAN964GJV|/analyses/ENCAN964GJV/} has in progress subobject quality standard {encode4-tf-chip|/quality-standards/encode4-tf-chip/} audit_warning: Processed alignments file {ENCFF283MZV|/files/ENCFF283MZV/} processed by ChIP-seq ENCODE4 v1.6.1 GRCh38 pipeline has 12050836 usable fragments. The minimum ENCODE standard for each replicate in a ChIP-seq experiment targeting TAF1-human and investigated as a transcription factor is 10 million usable fragments. The recommended value is > 20 million, but > 10 million is acceptable. (See {ENCODE ChIP-seq data standards|/data-standards/chip-seq/} ) audit_warning: Processed alignments file {ENCFF617ZDI|/files/ENCFF617ZDI/} processed by ChIP-seq ENCODE4 v1.6.1 GRCh38 pipeline has 18095793 usable fragments. The minimum ENCODE standard for each replicate in a ChIP-seq experiment targeting TAF1-human and investigated as a transcription factor is 10 million usable fragments. The recommended value is > 20 million, but > 10 million is acceptable. (See {ENCODE ChIP-seq data standards|/data-standards/chip-seq/} ) audit_warning: PBC1 (PCR Bottlenecking Coefficient 1, M1/M_distinct) is the ratio of the number of genomic locations where exactly one read maps uniquely (M1) to the number of genomic locations where some reads map (M_distinct). A PBC1 value in the range 0 - 0.5 is severe bottlenecking, 0.5 - 0.8 is moderate bottlenecking, 0.8 - 0.9 is mild bottlenecking, and > 0.9 is no bottlenecking. PBC1 value > 0.9 is recommended, but > 0.8 is acceptable. ENCODE processed alignments file {ENCFF617ZDI|/files/ENCFF617ZDI/} processed by ChIP-seq ENCODE4 v1.6.1 GRCh38 pipeline was generated from a library with PBC1 value of 0.83. audit_warning: PBC2 (PCR Bottlenecking Coefficient 2, M1/M2) is the ratio of the number of genomic locations where exactly one read maps uniquely (M1) to the number of genomic locations where two reads map uniquely (M2). A PBC2 value in the range 0 - 1 is severe bottlenecking, 1 - 3 is moderate bottlenecking, 3 - 10 is mild bottlenecking, > 10 is no bottlenecking. PBC2 value > 10 is recommended, but > 3 is acceptable. ENCODE processed alignments file {ENCFF617ZDI|/files/ENCFF617ZDI/} processed by ChIP-seq ENCODE4 v1.6.1 GRCh38 pipeline was generated from a library with PBC2 value of 5.70. audit_warning: Replicate concordance in ChIP-seq experiments is measured by calculating IDR values (Irreproducible Discovery Rate). ENCODE processed IDR thresholded peaks files {ENCFF502IPK|/files/ENCFF502IPK/} processed by ChIP-seq ENCODE4 v1.6.1 GRCh38 pipeline have a rescue ratio of 1.15 and a self consistency ratio of 2.99. According to ENCODE standards, having both rescue ratio and self consistency ratio values < 2 is recommended, but having only one of the ratio values < 2 is acceptable. |
| Labels |
|
Scores (1)
| ID | Type | Default annotation | Description | Histogram | Range | Summary |
|---|---|---|---|---|---|---|
| TF_ChIP-seq_ENCSR000BGS | float |
TF_ChIP-seq_ENCSR000BGS |
TF_ChIP-seq ENCSR000BGS [biosample_summary="Homo sapiens GM12878" and target="TAF1"]
|
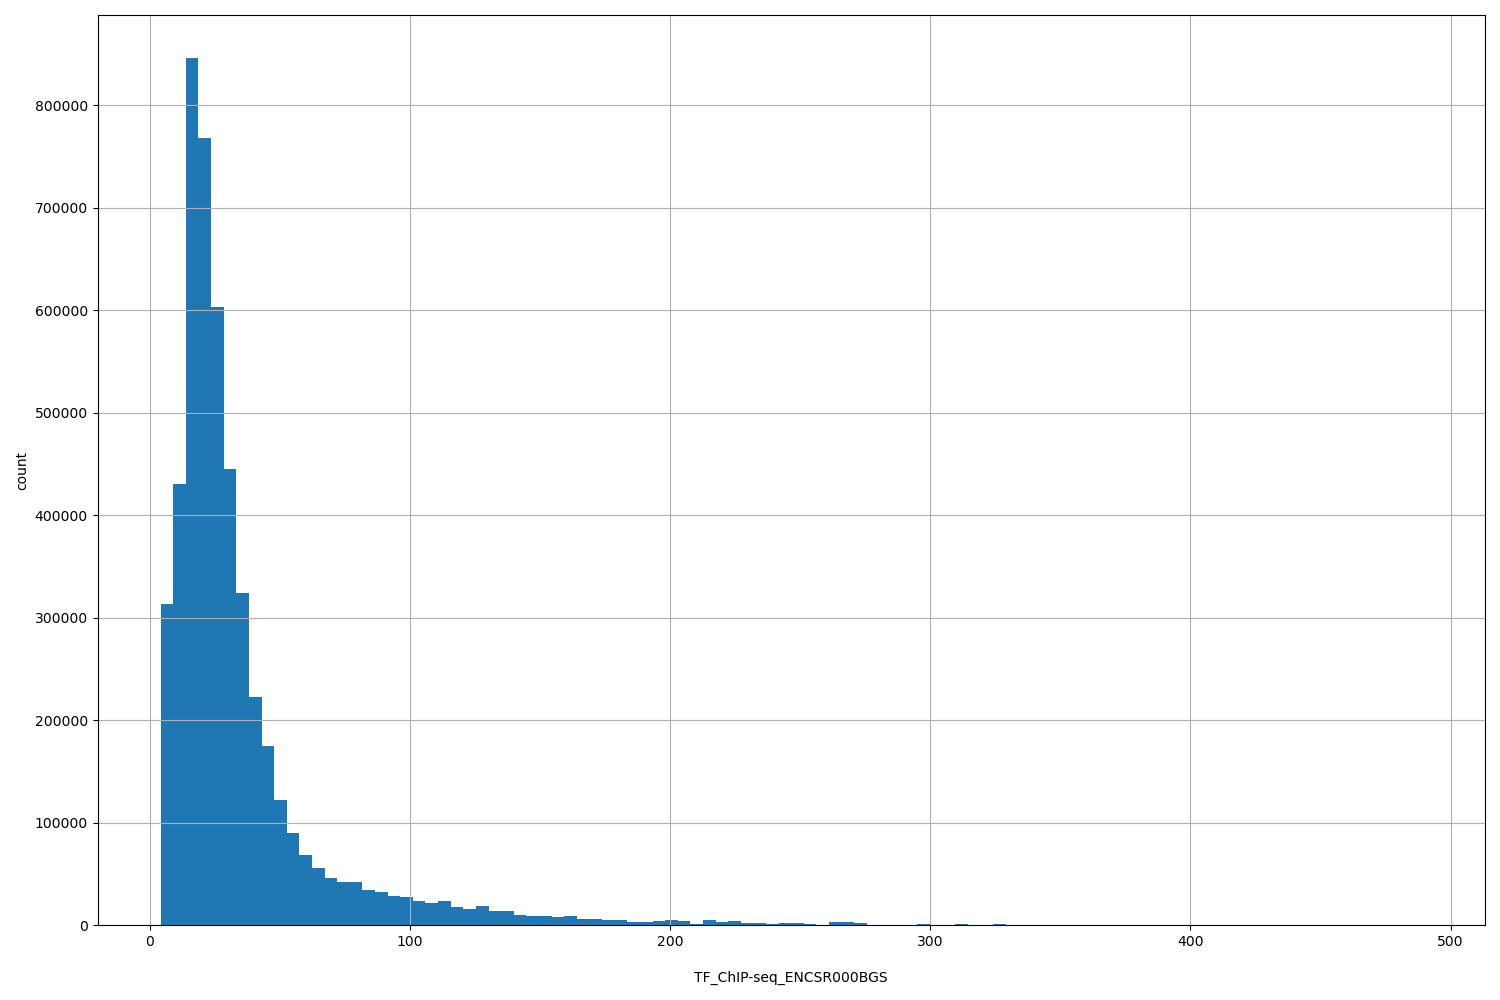 |
[4.17, 489] |
|
n counts base pairs; sd is the population standard deviation.
Coverage
| Chromosome | Covered positions | Covered % | Segments |
|---|---|---|---|
| all chromosomes | 5004979 | 0.16% | 19130 |
| chr1 | 493947 | 0.20% | 1907 |
| chr2 | 361315 | 0.15% | 1380 |
| chr3 | 293108 | 0.15% | 1131 |
| chr4 | 186108 | 0.10% | 702 |
| chr5 | 238487 | 0.13% | 912 |
| chr6 | 315667 | 0.18% | 1200 |
| chr7 | 226650 | 0.14% | 855 |
| chr8 | 181804 | 0.13% | 686 |
| chr9 | 204770 | 0.15% | 773 |
| chr10 | 219930 | 0.16% | 842 |
| chr11 | 246278 | 0.18% | 931 |
| chr12 | 269168 | 0.20% | 1042 |
| chr13 | 101456 | 0.09% | 384 |
| chr14 | 173462 | 0.16% | 678 |
| chr15 | 169025 | 0.17% | 658 |
| chr16 | 201664 | 0.22% | 759 |
| chr17 | 298969 | 0.36% | 1165 |
| chr18 | 84966 | 0.11% | 330 |
| chr19 | 314897 | 0.54% | 1188 |
| chr20 | 124829 | 0.19% | 476 |
| chr21 | 56219 | 0.12% | 214 |
| chr22 | 126171 | 0.25% | 483 |
| chrX | 116089 | 0.07% | 434 |
| 3343 contigs with no values (186304500 bp) | 0 | 0.00% | 0 |
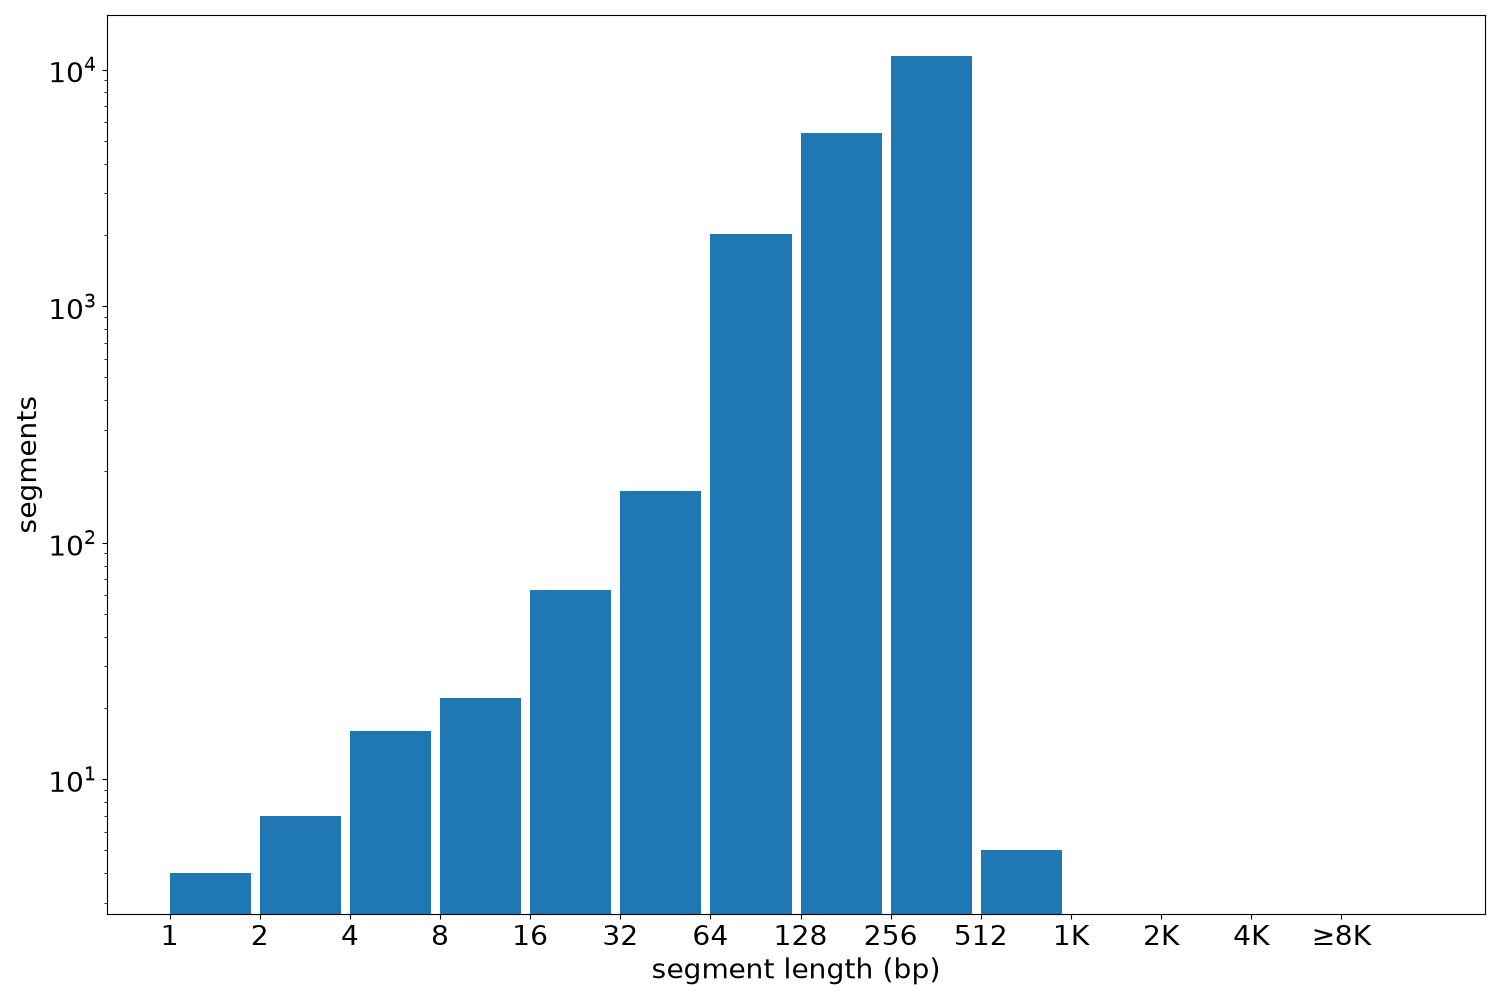
Segment lengths
| segments | min | max | mean | median | |
|---|---|---|---|---|---|
| segments | 19130 | 1 | 620 | 261.63 | 330 |
Files
| Filename | Size | md5 |
|---|---|---|
| ENCFF502IPK.bed.gz | 285.34 KB | 94f59d1843f85d07290903fc9c460a2a |
| ENCFF502IPK.tabix.bed.gz | 219.42 KB | b2a7532a08383040566ef28adce13dec |
| ENCFF502IPK.tabix.bed.gz.tbi | 104.04 KB | 49dca8d7e2bbcc2f5ff5a0cdb317b941 |
| genomic_resource.yaml | 4.2 KB | 5112c80a4a007a65a6cc013ede6100bd |
| statistics/ |