Resource
| Id | TF_ChIP-seq/ENCSR000ATC |
|---|---|
| Type | position_score |
| Version | 0 |
| Summary | TF_ChIP-seq ENCSR000ATC [biosample_summary="Homo sapiens HeLa-S3" and target="EZH2"] |
| Description |
status: released biological_replicates: Rep 1, Rep 2 summary: output_type: optimal IDR thresholded peaks audit_internal_action: Archived analysis {ENCAN753MZA|/analyses/ENCAN753MZA/} has in progress subobject quality standard {encode3-tf-chip|/quality-standards/encode3-tf-chip/} audit_warning: PBC1 (PCR Bottlenecking Coefficient 1, M1/M_distinct) is the ratio of the number of genomic locations where exactly one read maps uniquely (M1) to the number of genomic locations where some reads map (M_distinct). A PBC1 value in the range 0 - 0.5 is severe bottlenecking, 0.5 - 0.8 is moderate bottlenecking, 0.8 - 0.9 is mild bottlenecking, and > 0.9 is no bottlenecking. PBC1 value > 0.9 is recommended, but > 0.8 is acceptable. ENCODE processed alignments file {ENCFF162NDI|/files/ENCFF162NDI/} processed by ChIP-seq ENCODE3 hg19 pipeline was generated from a library with PBC1 value of 0.89. audit_warning: PBC2 (PCR Bottlenecking Coefficient 2, M1/M2) is the ratio of the number of genomic locations where exactly one read maps uniquely (M1) to the number of genomic locations where two reads map uniquely (M2). A PBC2 value in the range 0 - 1 is severe bottlenecking, 1 - 3 is moderate bottlenecking, 3 - 10 is mild bottlenecking, > 10 is no bottlenecking. PBC2 value > 10 is recommended, but > 3 is acceptable. ENCODE processed alignments file {ENCFF162NDI|/files/ENCFF162NDI/} processed by ChIP-seq ENCODE3 hg19 pipeline was generated from a library with PBC2 value of 8.84. |
| Labels |
|
Scores (1)
| ID | Type | Default annotation | Description | Histogram | Range | Summary |
|---|---|---|---|---|---|---|
| TF_ChIP-seq_ENCSR000ATC | float |
TF_ChIP-seq_ENCSR000ATC |
TF_ChIP-seq ENCSR000ATC [biosample_summary="Homo sapiens HeLa-S3" and target="EZH2"]
|
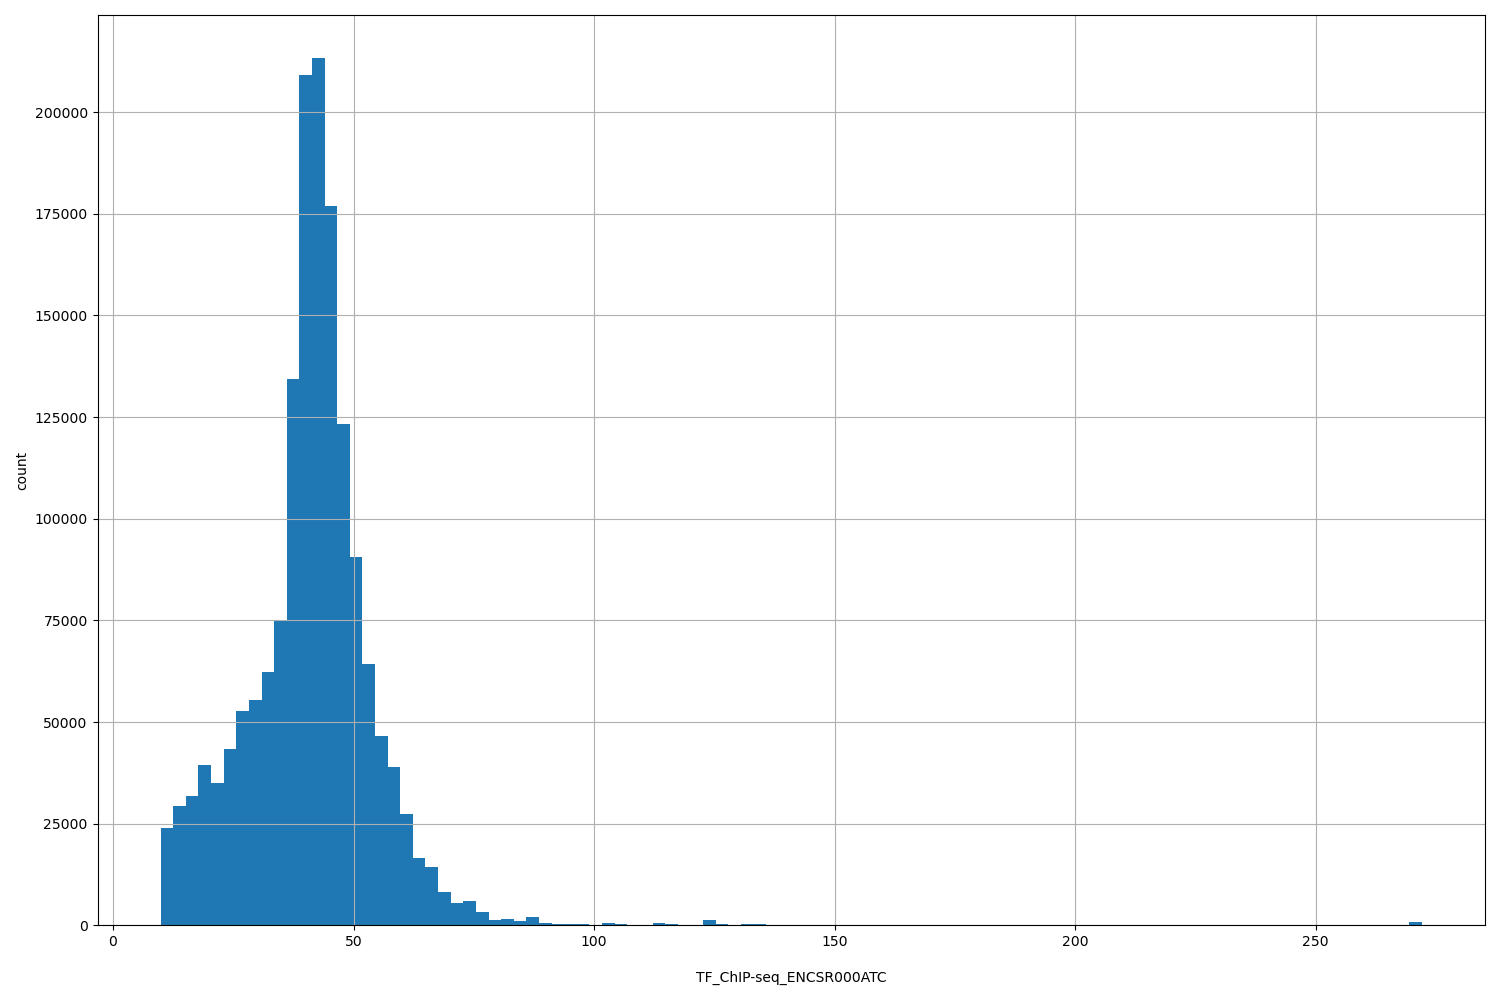 |
[9.88, 272] |
|
n counts base pairs; sd is the population standard deviation.
Coverage
| Chromosome | Covered positions | Covered % | Segments |
|---|---|---|---|
| all chromosomes | 1640227 | 0.05% | 3694 |
| chr1 | 154125 | 0.06% | 337 |
| chr2 | 34435 | 0.01% | 69 |
| chr3 | 43900 | 0.02% | 85 |
| chr4 | 7716 | <0.01% | 14 |
| chr5 | 222860 | 0.12% | 520 |
| chr6 | 50011 | 0.03% | 117 |
| chr7 | 72010 | 0.05% | 159 |
| chr8 | 111614 | 0.08% | 256 |
| chr9 | 91735 | 0.07% | 213 |
| chr10 | 67971 | 0.05% | 152 |
| chr11 | 104119 | 0.08% | 238 |
| chr12 | 94351 | 0.07% | 207 |
| chr13 | 43971 | 0.04% | 96 |
| chr14 | 40341 | 0.04% | 88 |
| chr15 | 112640 | 0.11% | 237 |
| chr16 | 60484 | 0.07% | 145 |
| chr17 | 80998 | 0.10% | 188 |
| chr18 | 39358 | 0.05% | 84 |
| chr19 | 34491 | 0.06% | 70 |
| chr20 | 119154 | 0.18% | 290 |
| chr21 | 16137 | 0.03% | 39 |
| chr22 | 12738 | 0.03% | 27 |
| chrX | 25068 | 0.02% | 63 |
| 3343 contigs with no values (186304500 bp) | 0 | 0.00% | 0 |
Segment lengths
| segments | min | max | mean | median | |
|---|---|---|---|---|---|
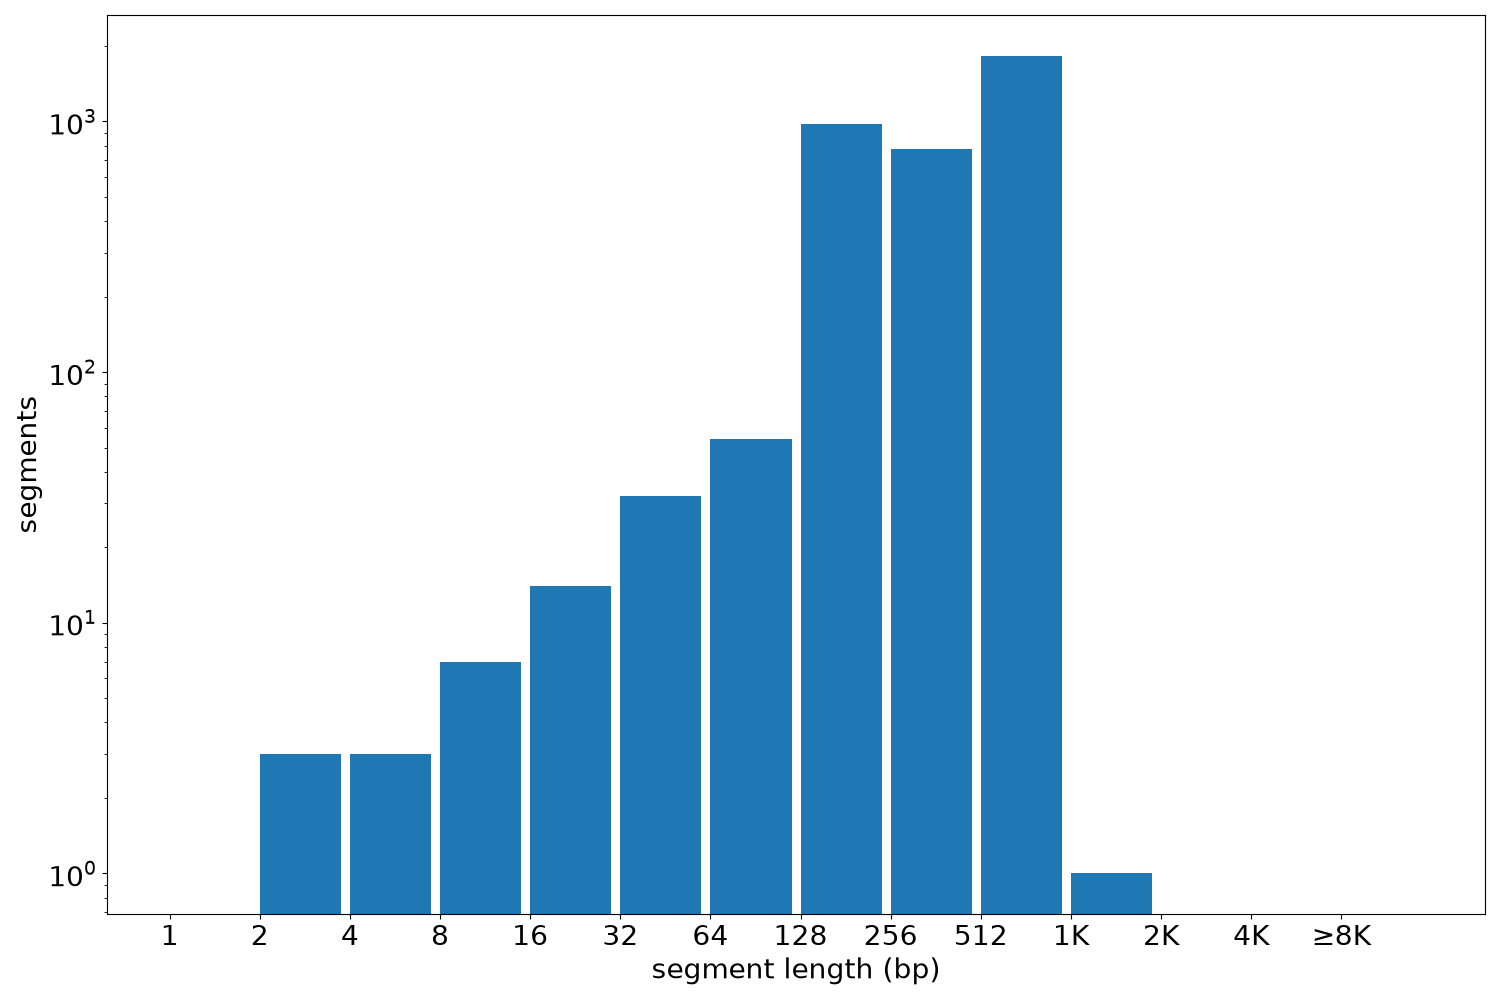
| segments | 3694 | 2 | 1409 | 444.02 | 475 |
Files
| Filename | Size | md5 |
|---|---|---|
| ENCFF751GGI.bed.gz | 56.07 KB | 7aedab00b9f60d6da4433352c11c9015 |
| ENCFF751GGI.tabix.bed.gz | 43.4 KB | bf7c17cc92b5f4774c9cf58633c187ea |
| ENCFF751GGI.tabix.bed.gz.tbi | 24.97 KB | 41f009c37d6223402525c0fb48ab7916 |
| genomic_resource.yaml | 2.65 KB | 0c0de71674dfca73f6227607ceeef39c |
| statistics/ |