Resource
| Id | TF_ChIP-seq/ENCSR000ARO |
|---|---|
| Type | position_score |
| Version | 0 |
| Summary | TF_ChIP-seq ENCSR000ARO [biosample_summary="Homo sapiens fibroblast of lung female child (11 years) and male adult (45 years)" and target="EZH2"] |
| Description |
status: released biological_replicates: Rep 1, Rep 2 summary: female child (11 years) male adult (45 years) output_type: optimal IDR thresholded peaks audit_internal_action: File {ENCFF279MNV|/files/ENCFF279MNV/} with status 'released' is derived from file {ENCFF419RSJ|/files/ENCFF419RSJ/} with status 'archived'. audit_internal_action: Archived analysis {ENCAN658MAN|/analyses/ENCAN658MAN/} has in progress subobject quality standard {encode3-tf-chip|/quality-standards/encode3-tf-chip/} audit_warning: PBC1 (PCR Bottlenecking Coefficient 1, M1/M_distinct) is the ratio of the number of genomic locations where exactly one read maps uniquely (M1) to the number of genomic locations where some reads map (M_distinct). A PBC1 value in the range 0 - 0.5 is severe bottlenecking, 0.5 - 0.8 is moderate bottlenecking, 0.8 - 0.9 is mild bottlenecking, and > 0.9 is no bottlenecking. PBC1 value > 0.9 is recommended, but > 0.8 is acceptable. ENCODE processed alignments file {ENCFF171PUL|/files/ENCFF171PUL/} processed by ChIP-seq ENCODE3 GRCh38 pipeline was generated from a library with PBC1 value of 0.81. audit_warning: PBC2 (PCR Bottlenecking Coefficient 2, M1/M2) is the ratio of the number of genomic locations where exactly one read maps uniquely (M1) to the number of genomic locations where two reads map uniquely (M2). A PBC2 value in the range 0 - 1 is severe bottlenecking, 1 - 3 is moderate bottlenecking, 3 - 10 is mild bottlenecking, > 10 is no bottlenecking. PBC2 value > 10 is recommended, but > 3 is acceptable. ENCODE processed alignments file {ENCFF171PUL|/files/ENCFF171PUL/} processed by ChIP-seq ENCODE3 GRCh38 pipeline was generated from a library with PBC2 value of 5.14. audit_warning: PBC1 (PCR Bottlenecking Coefficient 1, M1/M_distinct) is the ratio of the number of genomic locations where exactly one read maps uniquely (M1) to the number of genomic locations where some reads map (M_distinct). A PBC1 value in the range 0 - 0.5 is severe bottlenecking, 0.5 - 0.8 is moderate bottlenecking, 0.8 - 0.9 is mild bottlenecking, and > 0.9 is no bottlenecking. PBC1 value > 0.9 is recommended, but > 0.8 is acceptable. ENCODE processed alignments file {ENCFF072QPI|/files/ENCFF072QPI/} processed by ChIP-seq ENCODE3 GRCh38 pipeline was generated from a library with PBC1 value of 0.88. audit_warning: PBC2 (PCR Bottlenecking Coefficient 2, M1/M2) is the ratio of the number of genomic locations where exactly one read maps uniquely (M1) to the number of genomic locations where two reads map uniquely (M2). A PBC2 value in the range 0 - 1 is severe bottlenecking, 1 - 3 is moderate bottlenecking, 3 - 10 is mild bottlenecking, > 10 is no bottlenecking. PBC2 value > 10 is recommended, but > 3 is acceptable. ENCODE processed alignments file {ENCFF072QPI|/files/ENCFF072QPI/} processed by ChIP-seq ENCODE3 GRCh38 pipeline was generated from a library with PBC2 value of 8.18. |
| Labels |
|
Scores (1)
| ID | Type | Default annotation | Description | Histogram | Range | Summary |
|---|---|---|---|---|---|---|
| TF_ChIP-seq_ENCSR000ARO | float |
TF_ChIP-seq_ENCSR000ARO |
TF_ChIP-seq ENCSR000ARO [biosample_summary="Homo sapiens fibroblast of lung female child (11 years) and male adult (45 years)" and target="EZH2"]
|
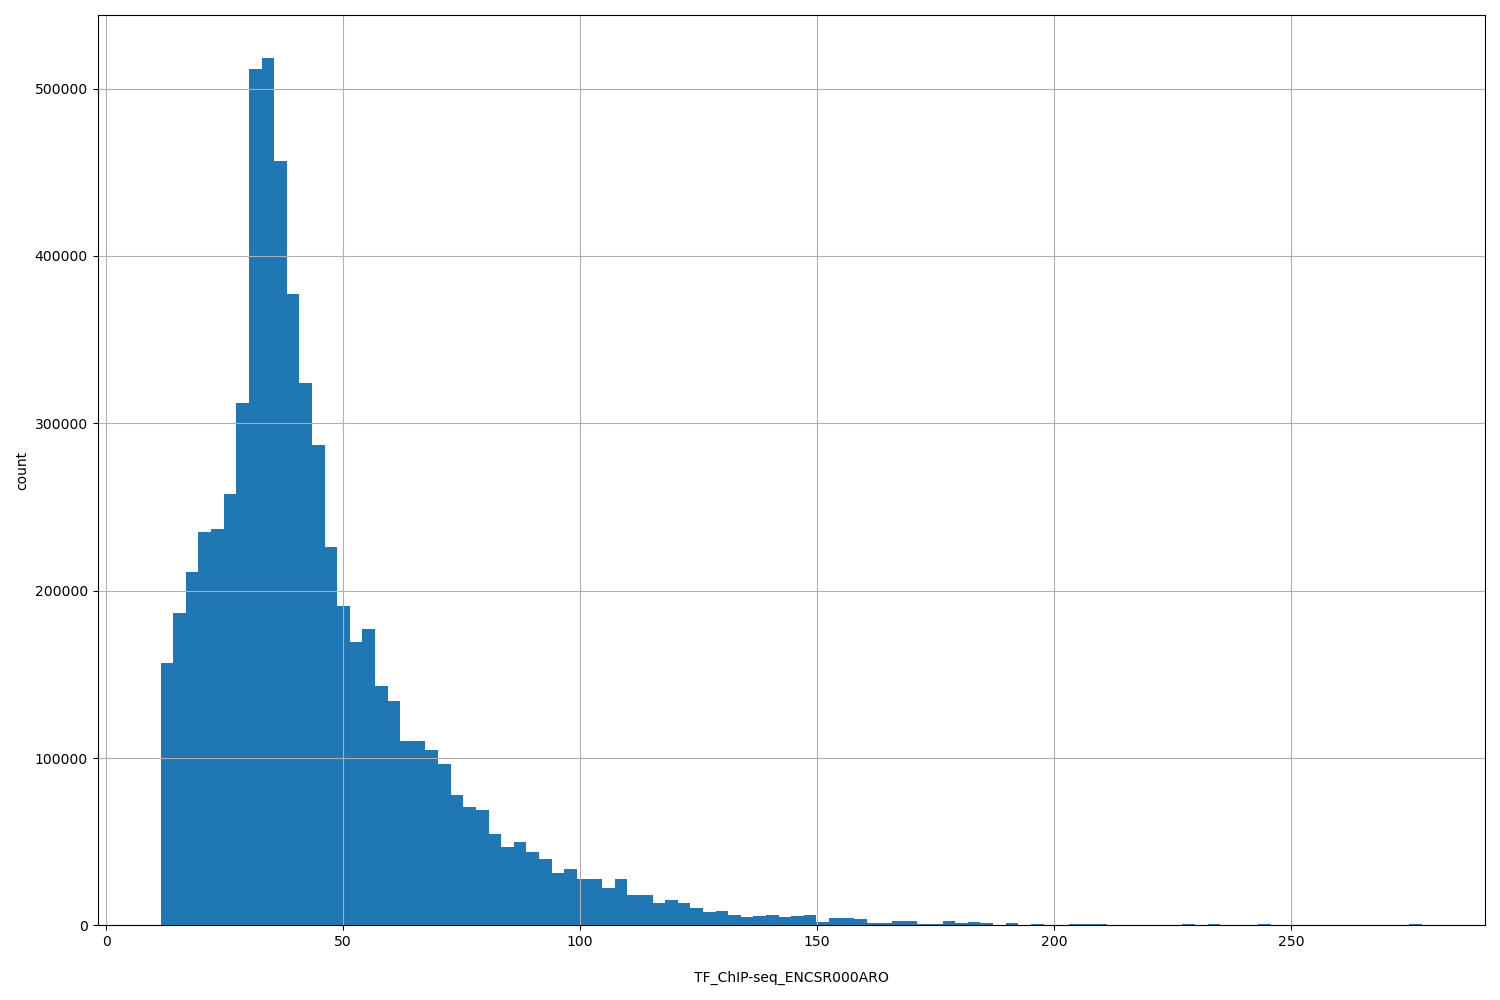 |
[11.5, 278] |
|
n counts base pairs; sd is the population standard deviation.
Coverage
| Chromosome | Covered positions | Covered % | Segments |
|---|---|---|---|
| all chromosomes | 6344137 | 0.20% | 17838 |
| chr1 | 653886 | 0.26% | 1824 |
| chr1_KI270713v1_random | 890 | 2.18% | 3 |
| chr2 | 492544 | 0.20% | 1425 |
| chr3 | 309784 | 0.16% | 855 |
| chr4 | 251203 | 0.13% | 729 |
| chr5 | 296489 | 0.16% | 797 |
| chr6 | 300472 | 0.18% | 879 |
| chr7 | 329179 | 0.21% | 950 |
| chr8 | 249899 | 0.17% | 725 |
| chr9 | 285700 | 0.21% | 792 |
| chr10 | 335145 | 0.25% | 941 |
| chr11 | 357358 | 0.26% | 994 |
| chr12 | 279656 | 0.21% | 801 |
| chr13 | 148069 | 0.13% | 419 |
| chr14 | 218720 | 0.20% | 598 |
| chr15 | 219660 | 0.22% | 629 |
| chr16 | 190454 | 0.21% | 514 |
| chr17 | 440256 | 0.53% | 1230 |
| chr17_GL000205v2_random | 604 | 0.33% | 1 |
| chr18 | 110564 | 0.14% | 315 |
| chr19 | 307106 | 0.52% | 861 |
| chr20 | 261654 | 0.41% | 723 |
| chr21 | 67376 | 0.14% | 191 |
| chr22 | 162417 | 0.32% | 438 |
| chr22_KI270733v1_random | 992 | 0.55% | 3 |
| chrUn_KI270744v1 | 804 | 0.48% | 3 |
| chrX | 72445 | 0.05% | 195 |
| chrY | 811 | <0.01% | 3 |
| 3338 contigs with no values (128502505 bp) | 0 | 0.00% | 0 |
Segment lengths
| segments | min | max | mean | median | |
|---|---|---|---|---|---|
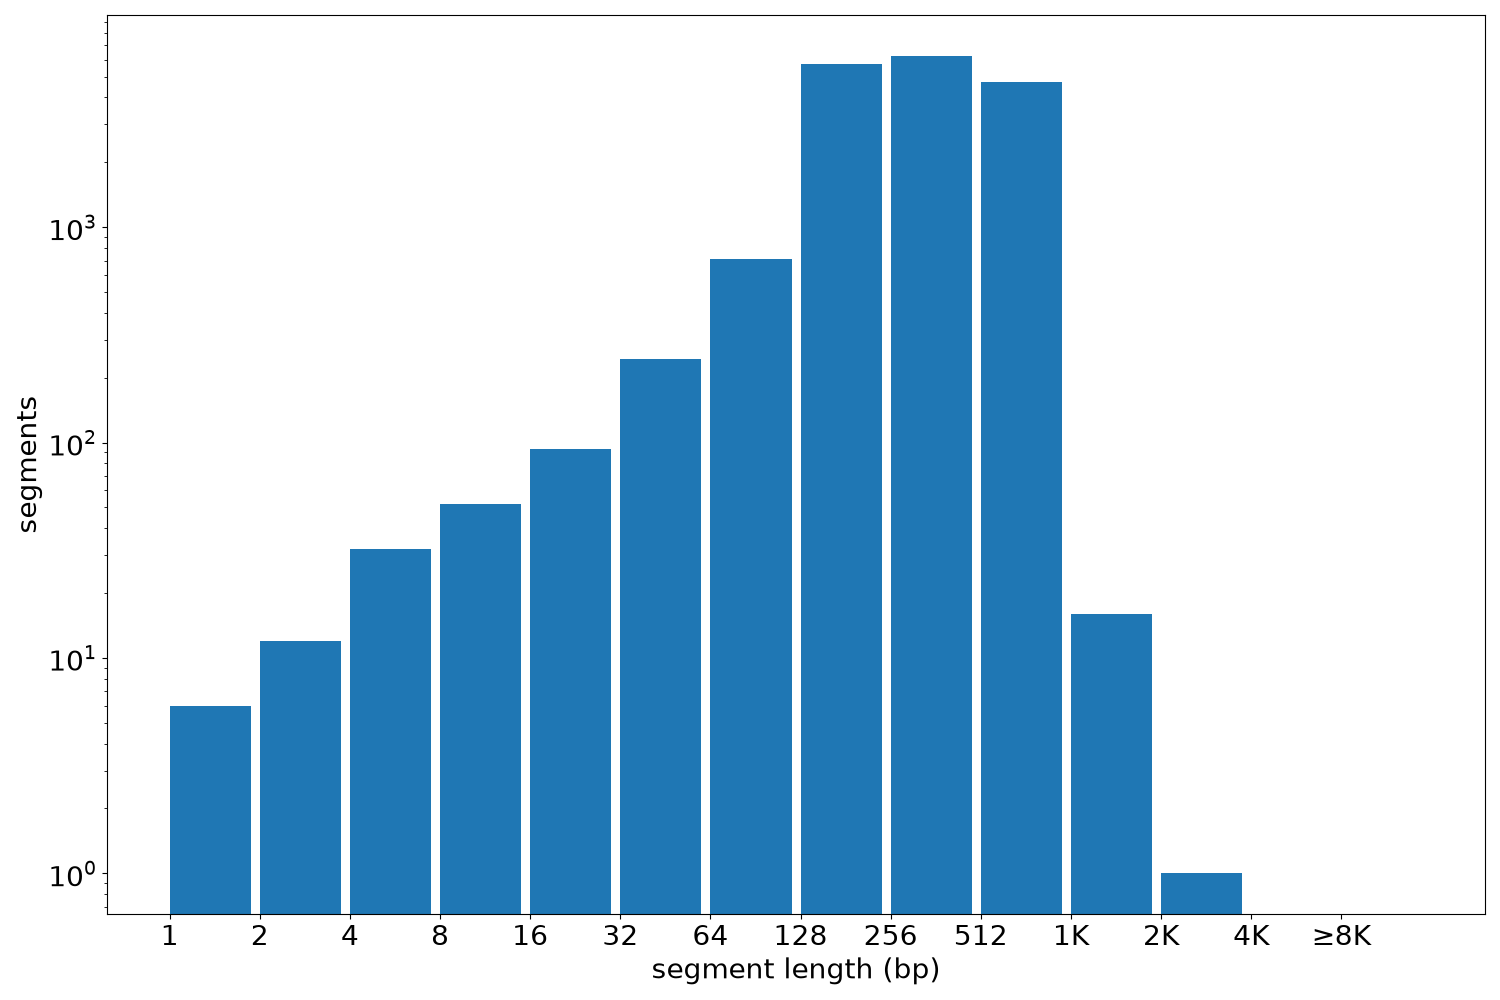
| segments | 17838 | 1 | 2266 | 355.65 | 316.5 |
Files
| Filename | Size | md5 |
|---|---|---|
| ENCFF279MNV.bed.gz | 238.63 KB | 904092bb16cdb31e52d6d49c5f484e24 |
| ENCFF279MNV.tabix.bed.gz | 200.72 KB | 15e18e06468c476914ccee62ee2de920 |
| ENCFF279MNV.tabix.bed.gz.tbi | 51.1 KB | 3e580ca829b8306b5be6b83cfbb136b3 |
| genomic_resource.yaml | 4.3 KB | 1b54544652fbdcad8f4be792c2576b71 |
| statistics/ |