Resource
| Id | TF_ChIP-seq/ENCSR000AKO |
|---|---|
| Type | position_score |
| Version | 0 |
| Summary | TF_ChIP-seq ENCSR000AKO [biosample_summary="Homo sapiens K562" and target="CTCF"] |
| Description |
status: released biological_replicates: Rep 1, Rep 2 summary: output_type: conservative IDR thresholded peaks audit_internal_action: Released analysis {ENCAN082OTH|/analyses/ENCAN082OTH/} has in progress subobject quality standard {encode4-tf-chip|/quality-standards/encode4-tf-chip/} audit_internal_action: Released analysis {ENCAN082OTH|/analyses/ENCAN082OTH/} has in progress subobject document {cfe5bda6-4b8b-4d3d-896c-62d51f4eed74|/documents/cfe5bda6-4b8b-4d3d-896c-62d51f4eed74/} audit_not_compliant: Processed alignments file {ENCFF834MPG|/files/ENCFF834MPG/} processed by ChIP-seq ENCODE4 v1.5.1 GRCh38 pipeline has 7556487 usable fragments. The minimum ENCODE standard for each replicate in a ChIP-seq experiment targeting CTCF-human and investigated as a transcription factor is 10 million usable fragments. The recommended value is > 20 million, but > 10 million is acceptable. (See {ENCODE ChIP-seq data standards|/data-standards/chip-seq/} ) audit_not_compliant: Processed alignments file {ENCFF173QSV|/files/ENCFF173QSV/} processed by ChIP-seq ENCODE4 v1.5.1 GRCh38 pipeline has 9168532 usable fragments. The minimum ENCODE standard for each replicate in a ChIP-seq experiment targeting CTCF-human and investigated as a transcription factor is 10 million usable fragments. The recommended value is > 20 million, but > 10 million is acceptable. (See {ENCODE ChIP-seq data standards|/data-standards/chip-seq/} ) audit_warning: PBC1 (PCR Bottlenecking Coefficient 1, M1/M_distinct) is the ratio of the number of genomic locations where exactly one read maps uniquely (M1) to the number of genomic locations where some reads map (M_distinct). A PBC1 value in the range 0 - 0.5 is severe bottlenecking, 0.5 - 0.8 is moderate bottlenecking, 0.8 - 0.9 is mild bottlenecking, and > 0.9 is no bottlenecking. PBC1 value > 0.9 is recommended, but > 0.8 is acceptable. ENCODE processed alignments file {ENCFF834MPG|/files/ENCFF834MPG/} processed by ChIP-seq ENCODE4 v1.5.1 GRCh38 pipeline was generated from a library with PBC1 value of 0.82. audit_warning: PBC2 (PCR Bottlenecking Coefficient 2, M1/M2) is the ratio of the number of genomic locations where exactly one read maps uniquely (M1) to the number of genomic locations where two reads map uniquely (M2). A PBC2 value in the range 0 - 1 is severe bottlenecking, 1 - 3 is moderate bottlenecking, 3 - 10 is mild bottlenecking, > 10 is no bottlenecking. PBC2 value > 10 is recommended, but > 3 is acceptable. ENCODE processed alignments file {ENCFF834MPG|/files/ENCFF834MPG/} processed by ChIP-seq ENCODE4 v1.5.1 GRCh38 pipeline was generated from a library with PBC2 value of 5.63. audit_warning: PBC1 (PCR Bottlenecking Coefficient 1, M1/M_distinct) is the ratio of the number of genomic locations where exactly one read maps uniquely (M1) to the number of genomic locations where some reads map (M_distinct). A PBC1 value in the range 0 - 0.5 is severe bottlenecking, 0.5 - 0.8 is moderate bottlenecking, 0.8 - 0.9 is mild bottlenecking, and > 0.9 is no bottlenecking. PBC1 value > 0.9 is recommended, but > 0.8 is acceptable. ENCODE processed alignments file {ENCFF173QSV|/files/ENCFF173QSV/} processed by ChIP-seq ENCODE4 v1.5.1 GRCh38 pipeline was generated from a library with PBC1 value of 0.86. audit_warning: PBC2 (PCR Bottlenecking Coefficient 2, M1/M2) is the ratio of the number of genomic locations where exactly one read maps uniquely (M1) to the number of genomic locations where two reads map uniquely (M2). A PBC2 value in the range 0 - 1 is severe bottlenecking, 1 - 3 is moderate bottlenecking, 3 - 10 is mild bottlenecking, > 10 is no bottlenecking. PBC2 value > 10 is recommended, but > 3 is acceptable. ENCODE processed alignments file {ENCFF173QSV|/files/ENCFF173QSV/} processed by ChIP-seq ENCODE4 v1.5.1 GRCh38 pipeline was generated from a library with PBC2 value of 7.27. |
| Labels |
|
Scores (1)
| ID | Type | Default annotation | Description | Histogram | Range | Summary |
|---|---|---|---|---|---|---|
| TF_ChIP-seq_ENCSR000AKO | float |
TF_ChIP-seq_ENCSR000AKO |
TF_ChIP-seq ENCSR000AKO [biosample_summary="Homo sapiens K562" and target="CTCF"]
|
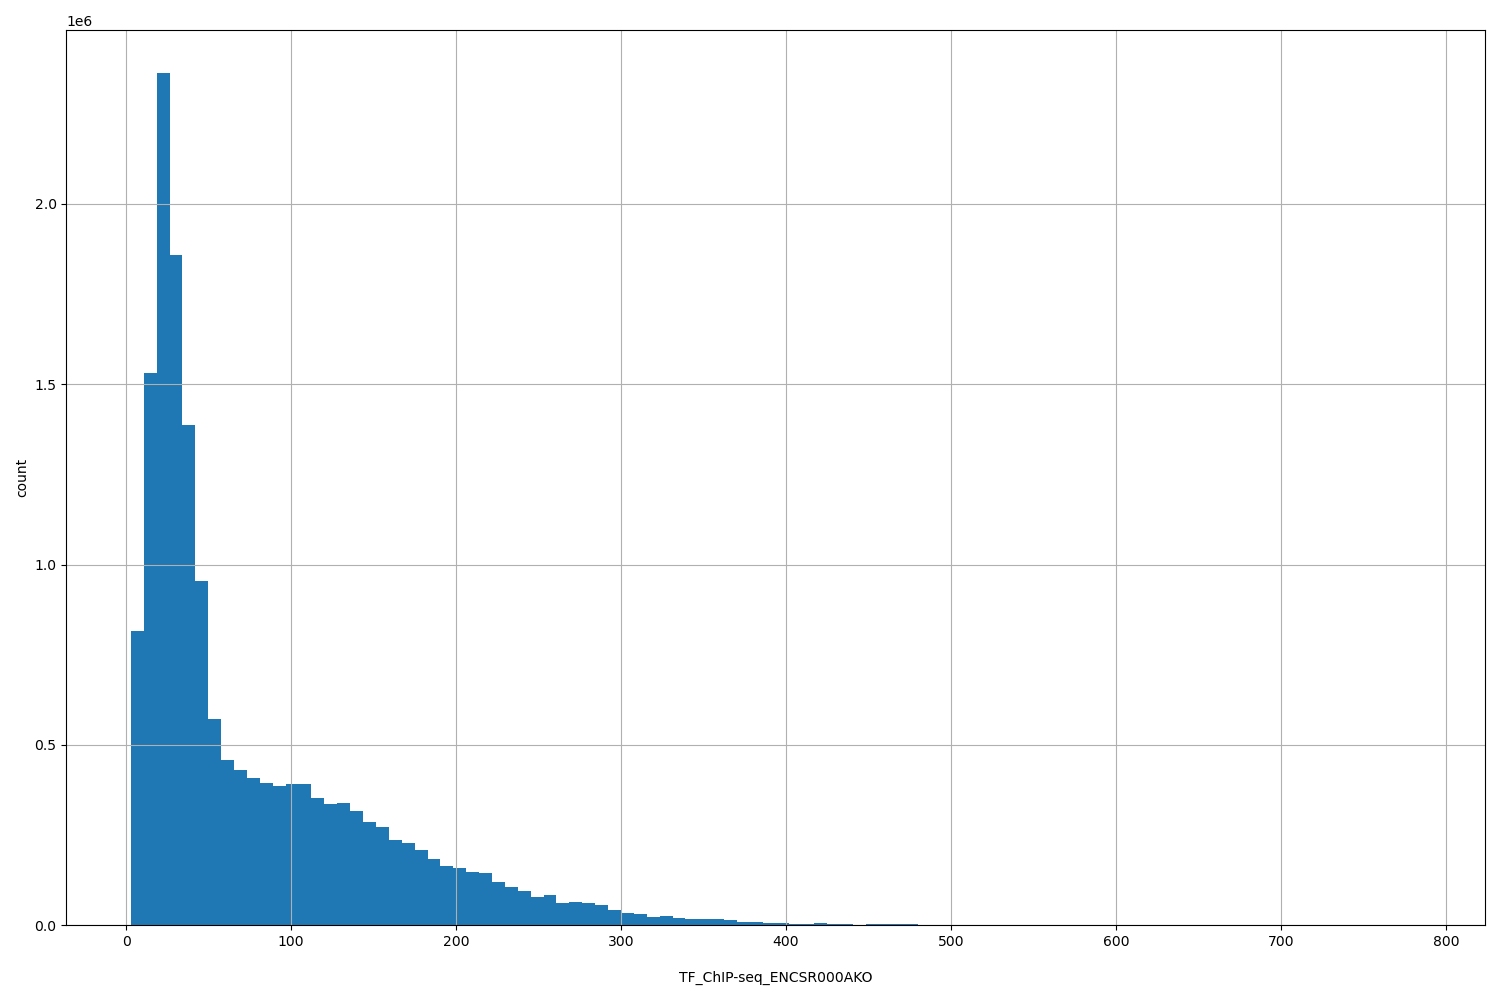 |
[2.81, 785] |
|
n counts base pairs; sd is the population standard deviation.
Coverage
| Chromosome | Covered positions | Covered % | Segments |
|---|---|---|---|
| all chromosomes | 16778294 | 0.52% | 55870 |
| chr1 | 1860811 | 0.75% | 6053 |
| chr2 | 1216884 | 0.50% | 4087 |
| chr3 | 966553 | 0.49% | 3228 |
| chr4 | 656682 | 0.35% | 2233 |
| chr5 | 842678 | 0.46% | 2812 |
| chr6 | 1007074 | 0.59% | 3311 |
| chr7 | 965478 | 0.61% | 3173 |
| chr8 | 713240 | 0.49% | 2396 |
| chr9 | 622386 | 0.45% | 2106 |
| chr10 | 780867 | 0.58% | 2631 |
| chr11 | 932477 | 0.69% | 3133 |
| chr12 | 814184 | 0.61% | 2698 |
| chr13 | 277343 | 0.24% | 935 |
| chr14 | 457751 | 0.43% | 1572 |
| chr15 | 571527 | 0.56% | 1937 |
| chr16 | 651929 | 0.72% | 2135 |
| chr17 | 819707 | 0.98% | 2753 |
| chr18 | 310693 | 0.39% | 1024 |
| chr19 | 758495 | 1.29% | 2498 |
| chr20 | 494135 | 0.77% | 1650 |
| chr21 | 205783 | 0.44% | 664 |
| chr22 | 368801 | 0.73% | 1207 |
| chrX | 482816 | 0.31% | 1634 |
| 3343 contigs with no values (186304500 bp) | 0 | 0.00% | 0 |
Segment lengths
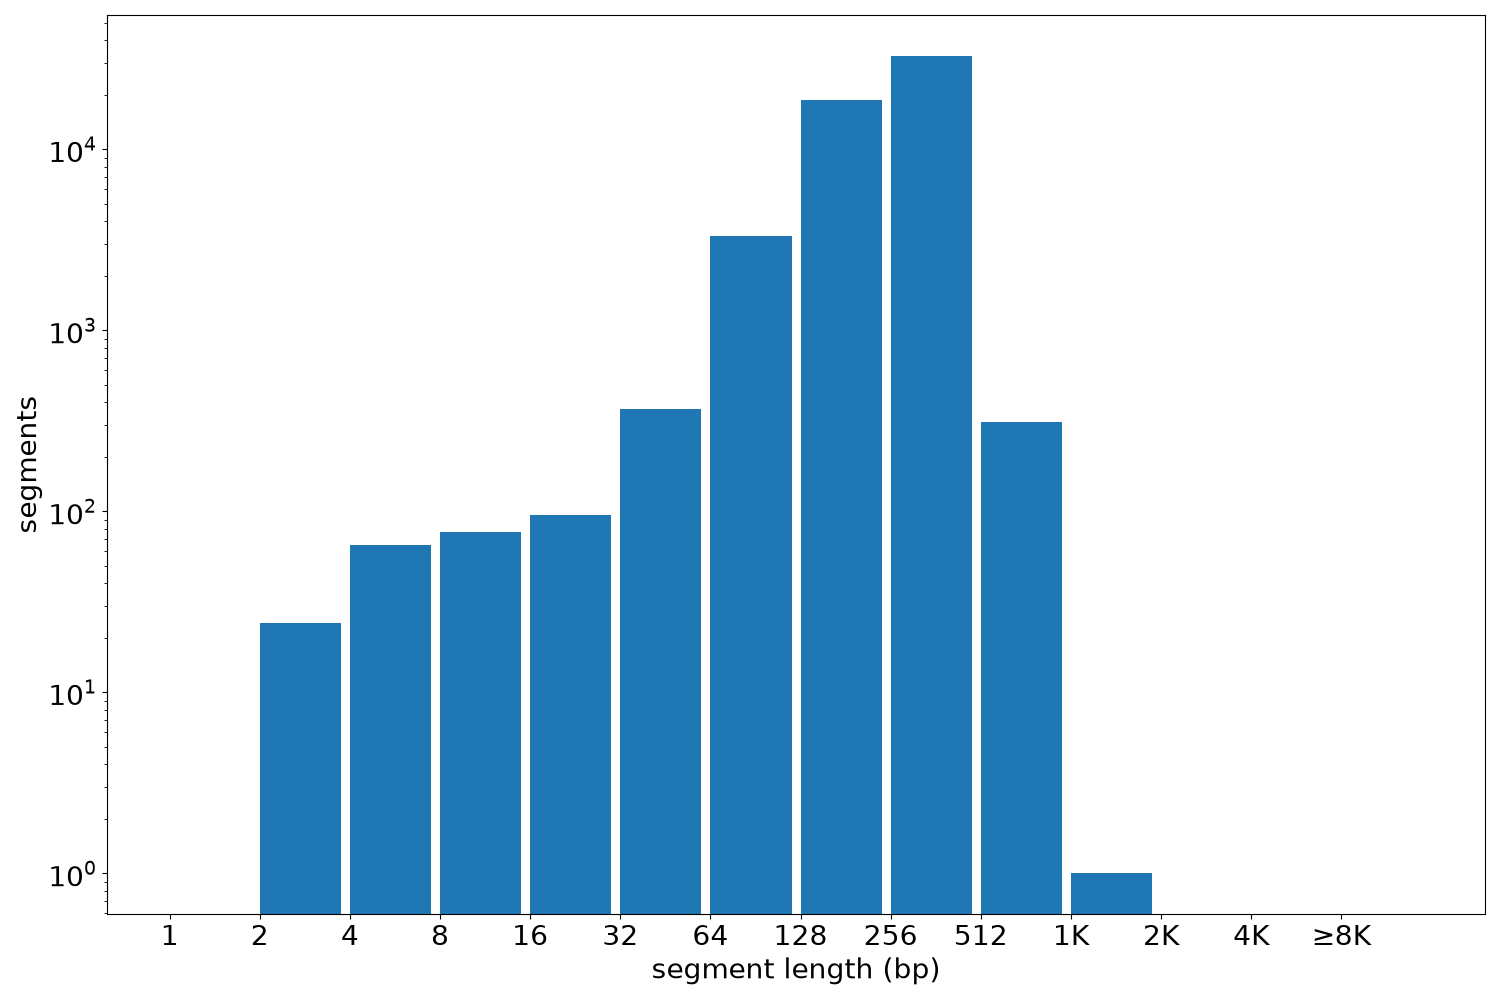
| segments | min | max | mean | median | |
|---|---|---|---|---|---|
| segments | 55870 | 2 | 1115 | 300.31 | 299 |
Files
| Filename | Size | md5 |
|---|---|---|
| ENCFF769AUF.bed.gz | 897.94 KB | 7d086cac19c5311a77b7e21e3d931435 |
| ENCFF769AUF.tabix.bed.gz | 648.85 KB | f30f587fd66127ebcda5819b03484276 |
| ENCFF769AUF.tabix.bed.gz.tbi | 280.32 KB | 4cc868512636321e9ad8ed25d622a74c |
| genomic_resource.yaml | 5.21 KB | 7aa8a32d39aee25f262e67fa6fde1c56 |
| statistics/ |