Resource
| Id | Histone_ChIP-seq/ENCSR972ETR |
|---|---|
| Type | position_score |
| Version | 0 |
| Summary | Histone_ChIP-seq ENCSR972ETR [biosample_summary="Homo sapiens gastrocnemius medialis tissue male adult (54 years)" and target="H3K4me3"] |
| Description |
status: released biological_replicates: Rep 1, Rep 2 summary: male adult (54 years) output_type: pseudoreplicated peaks audit_internal_action: Released analysis {ENCAN932AMB|/analyses/ENCAN932AMB/} has in progress subobject document {6d3db066-11bb-49fd-b71a-360495c86bae|/documents/6d3db066-11bb-49fd-b71a-360495c86bae/} audit_internal_action: Released analysis {ENCAN932AMB|/analyses/ENCAN932AMB/} has in progress subobject quality standard {encode4-histone-chip|/quality-standards/encode4-histone-chip/} audit_warning: PBC1 (PCR Bottlenecking Coefficient 1, M1/M_distinct) is the ratio of the number of genomic locations where exactly one read maps uniquely (M1) to the number of genomic locations where some reads map (M_distinct). A PBC1 value in the range 0 - 0.5 is severe bottlenecking, 0.5 - 0.8 is moderate bottlenecking, 0.8 - 0.9 is mild bottlenecking, and > 0.9 is no bottlenecking. PBC1 value > 0.9 is recommended, but > 0.8 is acceptable. ENCODE processed alignments file {ENCFF185CAR|/files/ENCFF185CAR/} processed by ChIP-seq ENCODE4 v1.5.1 GRCh38 pipeline was generated from a library with PBC1 value of 0.90. audit_warning: PBC2 (PCR Bottlenecking Coefficient 2, M1/M2) is the ratio of the number of genomic locations where exactly one read maps uniquely (M1) to the number of genomic locations where two reads map uniquely (M2). A PBC2 value in the range 0 - 1 is severe bottlenecking, 1 - 3 is moderate bottlenecking, 3 - 10 is mild bottlenecking, > 10 is no bottlenecking. PBC2 value > 10 is recommended, but > 3 is acceptable. ENCODE processed alignments file {ENCFF185CAR|/files/ENCFF185CAR/} processed by ChIP-seq ENCODE4 v1.5.1 GRCh38 pipeline was generated from a library with PBC2 value of 9.50. |
| Labels |
|
Scores (1)
| ID | Type | Default annotation | Description | Histogram | Range | Summary |
|---|---|---|---|---|---|---|
| Histone_ChIP-seq_ENCSR972ETR | float |
Histone_ChIP-seq_ENCSR972ETR |
Histone_ChIP-seq ENCSR972ETR [biosample_summary="Homo sapiens gastrocnemius medialis tissue male adult (54 years)" and target="H3K4me3"]
|
 |
[1.55, 23.6] |
|
n counts base pairs; sd is the population standard deviation.
Coverage
| Chromosome | Covered positions | Covered % | Segments |
|---|---|---|---|
| all chromosomes | 50897652 | 1.58% | 38119 |
| chr1 | 4930121 | 1.98% | 3632 |
| chr2 | 3612799 | 1.49% | 2710 |
| chr3 | 2999751 | 1.51% | 2146 |
| chr4 | 2193439 | 1.15% | 1635 |
| chr5 | 2510622 | 1.38% | 1802 |
| chr6 | 3073615 | 1.80% | 2212 |
| chr7 | 2517066 | 1.58% | 1959 |
| chr8 | 1960821 | 1.35% | 1483 |
| chr9 | 2092101 | 1.51% | 1618 |
| chr10 | 2326745 | 1.74% | 1762 |
| chr11 | 2582366 | 1.91% | 1830 |
| chr12 | 2673000 | 2.01% | 1876 |
| chr13 | 1116414 | 0.98% | 850 |
| chr14 | 1559082 | 1.46% | 1121 |
| chr15 | 1623627 | 1.59% | 1203 |
| chr16 | 1876784 | 2.08% | 1483 |
| chr17 | 2685306 | 3.23% | 2013 |
| chr18 | 906585 | 1.13% | 709 |
| chr19 | 3582241 | 6.11% | 2935 |
| chr20 | 1233655 | 1.91% | 937 |
| chr21 | 506282 | 1.08% | 404 |
| chr22 | 1026933 | 2.02% | 820 |
| chrX | 1268262 | 0.81% | 956 |
| chrY | 40035 | 0.07% | 23 |
| 3342 contigs with no values (129077085 bp) | 0 | 0.00% | 0 |
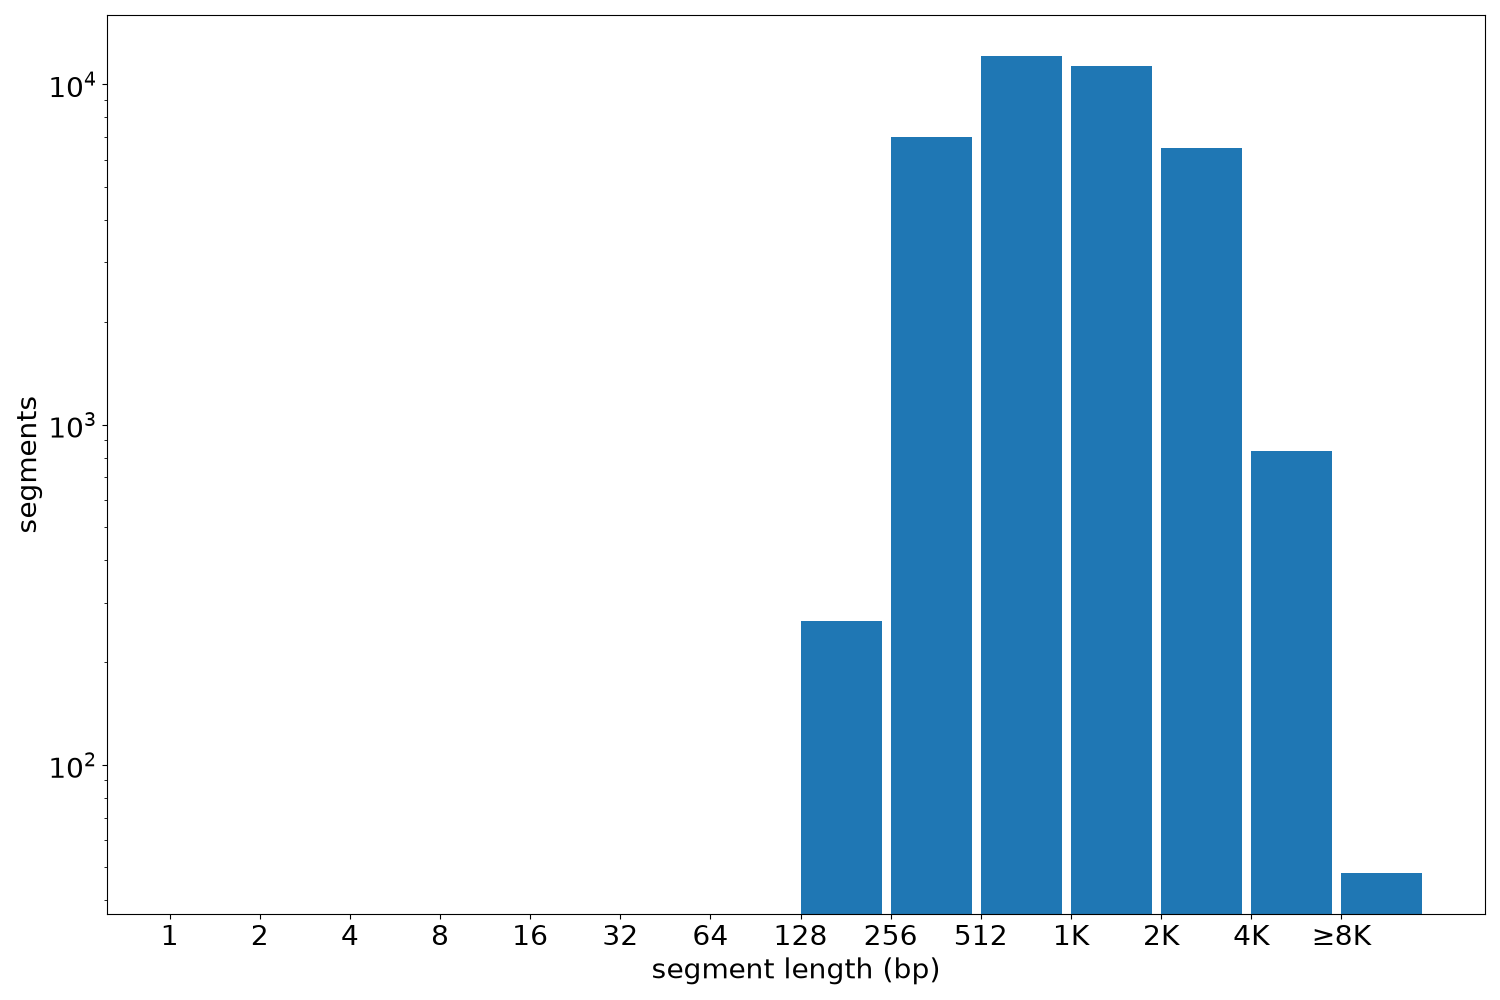
Segment lengths
| segments | min | max | mean | median | |
|---|---|---|---|---|---|
| segments | 38119 | 208 | 15846 | 1335.23 | 1003 |
Files
| Filename | Size | md5 |
|---|---|---|
| ENCFF082KCY.bed.gz | 1004.48 KB | 19a529d4e8b1fcbcfe91885438b1889f |
| ENCFF082KCY.tabix.bed.gz | 430.38 KB | c0f9de32f9d5f90757549db72e9140c3 |
| ENCFF082KCY.tabix.bed.gz.tbi | 193.89 KB | 812b6edab1a59dee450bb937afbc0da4 |
| genomic_resource.yaml | 3.01 KB | 67e3da6969ef7d77730551b1f9a0a0f0 |
| statistics/ |