Resource
| Id | Histone_ChIP-seq/ENCSR971ETA |
|---|---|
| Type | position_score |
| Version | 0 |
| Summary | Histone_ChIP-seq ENCSR971ETA [biosample_summary="Homo sapiens stomach smooth muscle tissue female adult (84 years)" and target="H3K27ac"] |
| Description |
status: released biological_replicates: Rep 1 summary: female adult (84 years) output_type: pseudoreplicated peaks audit_internal_action: Released analysis {ENCAN929KQL|/analyses/ENCAN929KQL/} has in progress subobject quality standard {encode4-histone-chip|/quality-standards/encode4-histone-chip/} audit_warning: PBC1 (PCR Bottlenecking Coefficient 1, M1/M_distinct) is the ratio of the number of genomic locations where exactly one read maps uniquely (M1) to the number of genomic locations where some reads map (M_distinct). A PBC1 value in the range 0 - 0.5 is severe bottlenecking, 0.5 - 0.8 is moderate bottlenecking, 0.8 - 0.9 is mild bottlenecking, and > 0.9 is no bottlenecking. PBC1 value > 0.9 is recommended, but > 0.8 is acceptable. ENCODE processed redacted alignments file {ENCFF338HBY|/files/ENCFF338HBY/} processed by ChIP-seq ENCODE4 v1.7.0 GRCh38 pipeline was generated from a library with PBC1 value of 0.86. audit_warning: PBC2 (PCR Bottlenecking Coefficient 2, M1/M2) is the ratio of the number of genomic locations where exactly one read maps uniquely (M1) to the number of genomic locations where two reads map uniquely (M2). A PBC2 value in the range 0 - 1 is severe bottlenecking, 1 - 3 is moderate bottlenecking, 3 - 10 is mild bottlenecking, > 10 is no bottlenecking. PBC2 value > 10 is recommended, but > 3 is acceptable. ENCODE processed redacted alignments file {ENCFF338HBY|/files/ENCFF338HBY/} processed by ChIP-seq ENCODE4 v1.7.0 GRCh38 pipeline was generated from a library with PBC2 value of 6.87. |
| Labels |
|
Scores (1)
| ID | Type | Default annotation | Description | Histogram | Range | Summary |
|---|---|---|---|---|---|---|
| Histone_ChIP-seq_ENCSR971ETA | float |
Histone_ChIP-seq_ENCSR971ETA |
Histone_ChIP-seq ENCSR971ETA [biosample_summary="Homo sapiens stomach smooth muscle tissue female adult (84 years)" and target="H3K27ac"]
|
 |
[1.75, 77.3] |
|
n counts base pairs; sd is the population standard deviation.
Coverage
| Chromosome | Covered positions | Covered % | Segments |
|---|---|---|---|
| all chromosomes | 69300023 | 2.15% | 49278 |
| chr1 | 7184534 | 2.89% | 4937 |
| chr2 | 5512509 | 2.28% | 3875 |
| chr3 | 4431633 | 2.23% | 3196 |
| chr4 | 2519226 | 1.32% | 1982 |
| chr5 | 3073558 | 1.69% | 2251 |
| chr6 | 3291707 | 1.93% | 2470 |
| chr7 | 2929292 | 1.84% | 2201 |
| chr8 | 2509370 | 1.73% | 1900 |
| chr9 | 3603442 | 2.60% | 2440 |
| chr10 | 3962745 | 2.96% | 2790 |
| chr11 | 4225391 | 3.13% | 2776 |
| chr12 | 3653579 | 2.74% | 2641 |
| chr13 | 1579196 | 1.38% | 1211 |
| chr14 | 2563079 | 2.39% | 1698 |
| chr15 | 2447730 | 2.40% | 1791 |
| chr16 | 2571419 | 2.85% | 1838 |
| chr17 | 3817159 | 4.58% | 2521 |
| chr18 | 1055616 | 1.31% | 822 |
| chr19 | 2847046 | 4.86% | 1936 |
| chr20 | 1859462 | 2.89% | 1330 |
| chr21 | 600389 | 1.29% | 464 |
| chr22 | 1707613 | 3.36% | 1148 |
| chrX | 1354328 | 0.87% | 1060 |
| 3343 contigs with no values (186304500 bp) | 0 | 0.00% | 0 |
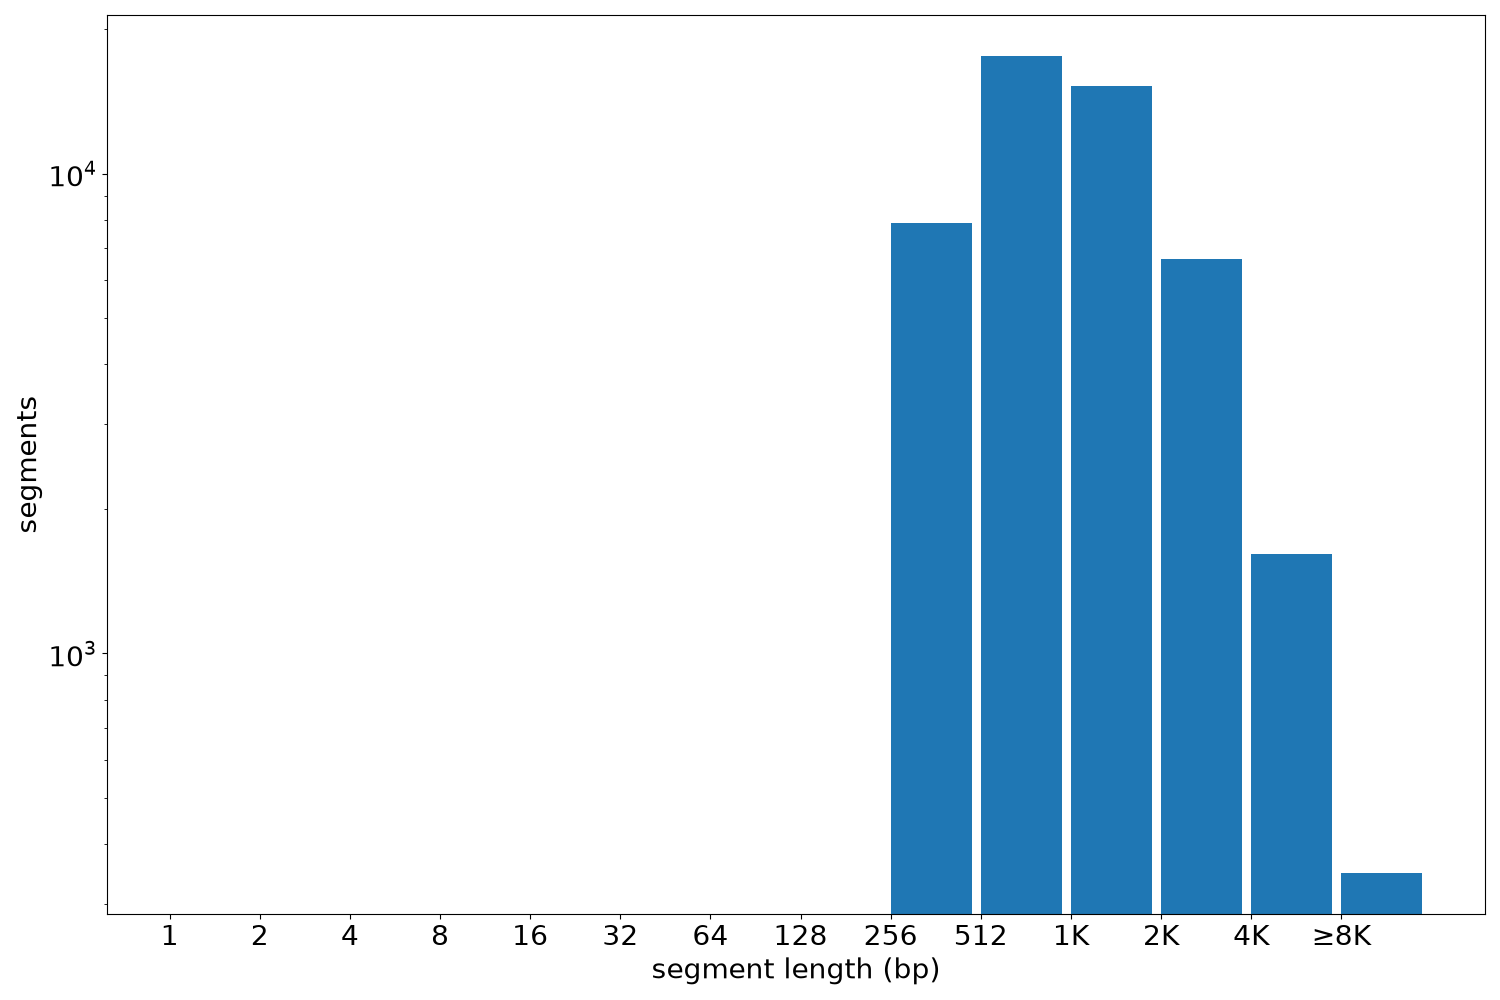
Segment lengths
| segments | min | max | mean | median | |
|---|---|---|---|---|---|
| segments | 49278 | 260 | 35586 | 1406.31 | 987 |
Files
| Filename | Size | md5 |
|---|---|---|
| ENCFF722LRM.bed.gz | 1009.54 KB | 4761541b9a70f465072d00a995b914dd |
| ENCFF722LRM.tabix.bed.gz | 495.96 KB | ed74fcc43e8016bcc11c05dcd1741fbb |
| ENCFF722LRM.tabix.bed.gz.tbi | 182.95 KB | 253023544f053f39bc01ea10d464c5c6 |
| genomic_resource.yaml | 2.83 KB | 5602034688ec14293efe9a8700692075 |
| statistics/ |