Resource
| Id | Histone_ChIP-seq/ENCSR962OTG |
|---|---|
| Type | position_score |
| Version | 0 |
| Summary | Histone_ChIP-seq ENCSR962OTG [biosample_summary="Homo sapiens from a donor with amyotrophic lateral sclerosis; motor neuron" and target="H3K4me3"] |
| Description |
status: released biological_replicates: Rep 1, Rep 2 summary: male child (6 years) with amyotrophic lateral sclerosis output_type: pseudoreplicated peaks audit_internal_action: Released analysis {ENCAN324MRJ|/analyses/ENCAN324MRJ/} has in progress subobject quality standard {encode4-histone-chip|/quality-standards/encode4-histone-chip/} audit_warning: PBC1 (PCR Bottlenecking Coefficient 1, M1/M_distinct) is the ratio of the number of genomic locations where exactly one read maps uniquely (M1) to the number of genomic locations where some reads map (M_distinct). A PBC1 value in the range 0 - 0.5 is severe bottlenecking, 0.5 - 0.8 is moderate bottlenecking, 0.8 - 0.9 is mild bottlenecking, and > 0.9 is no bottlenecking. PBC1 value > 0.9 is recommended, but > 0.8 is acceptable. ENCODE processed alignments file {ENCFF935IQP|/files/ENCFF935IQP/} processed by ChIP-seq ENCODE4 v1.9.0 GRCh38 pipeline was generated from a library with PBC1 value of 0.81. audit_warning: PBC2 (PCR Bottlenecking Coefficient 2, M1/M2) is the ratio of the number of genomic locations where exactly one read maps uniquely (M1) to the number of genomic locations where two reads map uniquely (M2). A PBC2 value in the range 0 - 1 is severe bottlenecking, 1 - 3 is moderate bottlenecking, 3 - 10 is mild bottlenecking, > 10 is no bottlenecking. PBC2 value > 10 is recommended, but > 3 is acceptable. ENCODE processed alignments file {ENCFF935IQP|/files/ENCFF935IQP/} processed by ChIP-seq ENCODE4 v1.9.0 GRCh38 pipeline was generated from a library with PBC2 value of 5.07. audit_warning: PBC1 (PCR Bottlenecking Coefficient 1, M1/M_distinct) is the ratio of the number of genomic locations where exactly one read maps uniquely (M1) to the number of genomic locations where some reads map (M_distinct). A PBC1 value in the range 0 - 0.5 is severe bottlenecking, 0.5 - 0.8 is moderate bottlenecking, 0.8 - 0.9 is mild bottlenecking, and > 0.9 is no bottlenecking. PBC1 value > 0.9 is recommended, but > 0.8 is acceptable. ENCODE processed alignments file {ENCFF856KJG|/files/ENCFF856KJG/} processed by ChIP-seq ENCODE4 v1.9.0 GRCh38 pipeline was generated from a library with PBC1 value of 0.81. audit_warning: PBC2 (PCR Bottlenecking Coefficient 2, M1/M2) is the ratio of the number of genomic locations where exactly one read maps uniquely (M1) to the number of genomic locations where two reads map uniquely (M2). A PBC2 value in the range 0 - 1 is severe bottlenecking, 1 - 3 is moderate bottlenecking, 3 - 10 is mild bottlenecking, > 10 is no bottlenecking. PBC2 value > 10 is recommended, but > 3 is acceptable. ENCODE processed alignments file {ENCFF856KJG|/files/ENCFF856KJG/} processed by ChIP-seq ENCODE4 v1.9.0 GRCh38 pipeline was generated from a library with PBC2 value of 5.05. |
| Labels |
|
Scores (1)
| ID | Type | Default annotation | Description | Histogram | Range | Summary |
|---|---|---|---|---|---|---|
| Histone_ChIP-seq_ENCSR962OTG | float |
Histone_ChIP-seq_ENCSR962OTG |
Histone_ChIP-seq ENCSR962OTG [biosample_summary="Homo sapiens from a donor with amyotrophic lateral sclerosis; motor neuron" and target="H3K4me3"]
|
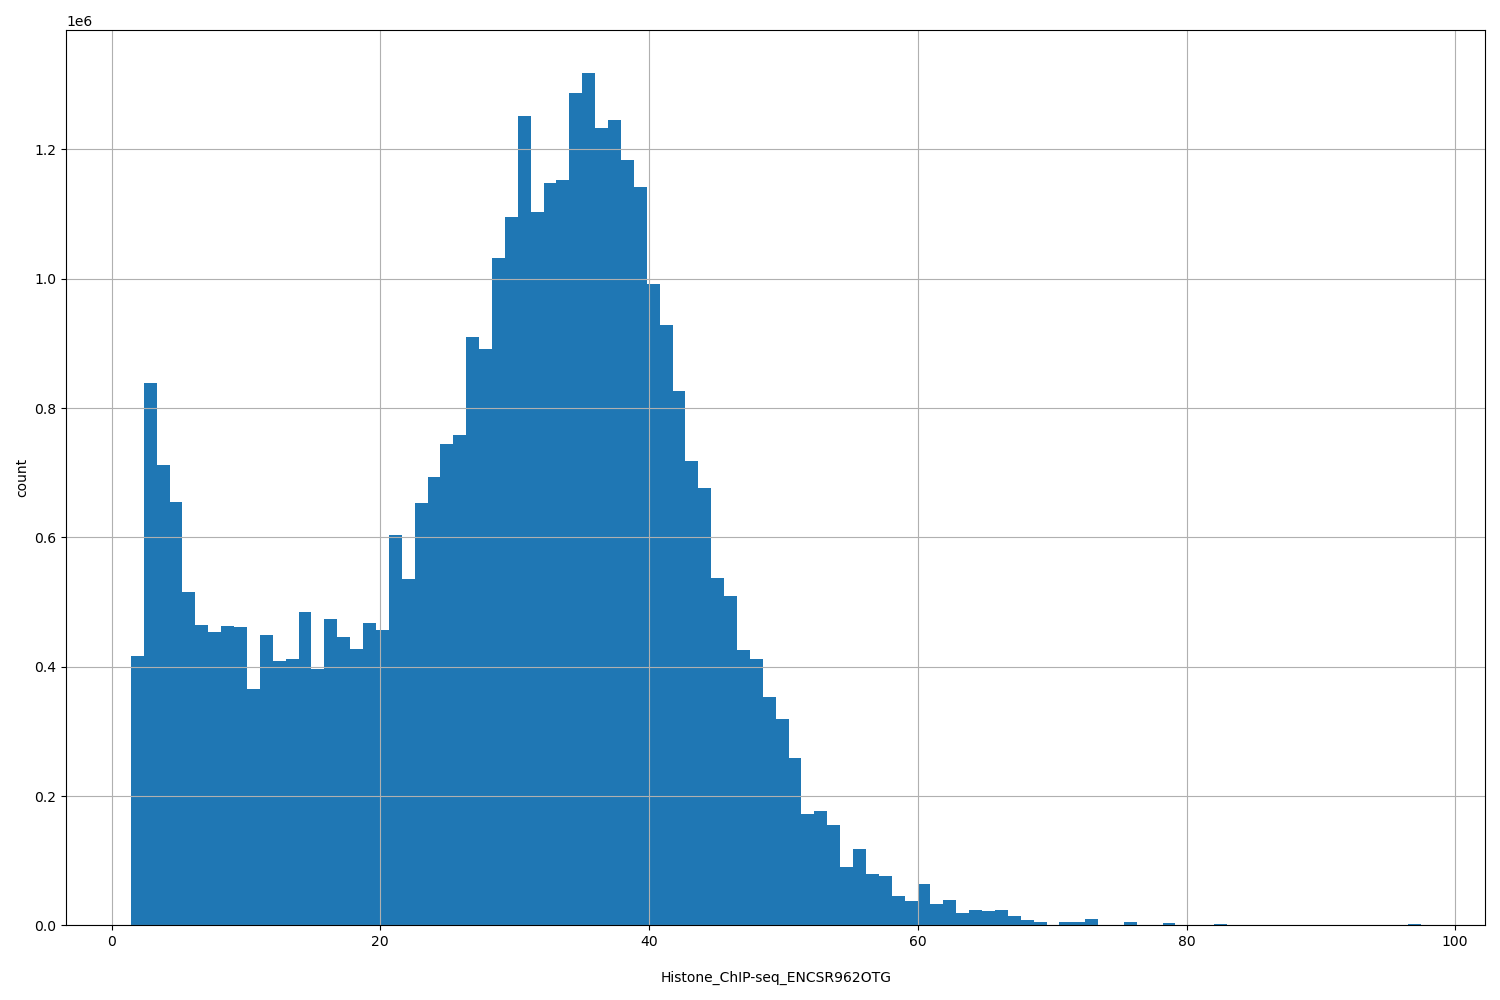 |
[1.43, 97.4] |
|
n counts base pairs; sd is the population standard deviation.
Coverage
| Chromosome | Covered positions | Covered % | Segments |
|---|---|---|---|
| all chromosomes | 37948450 | 1.18% | 21560 |
| chr1 | 3761584 | 1.51% | 2177 |
| chr2 | 2568610 | 1.06% | 1419 |
| chr3 | 2078871 | 1.05% | 1170 |
| chr4 | 1545519 | 0.81% | 819 |
| chr5 | 1806606 | 1.00% | 1025 |
| chr6 | 2188960 | 1.28% | 1199 |
| chr7 | 1848949 | 1.16% | 1024 |
| chr8 | 1420071 | 0.98% | 799 |
| chr9 | 1516964 | 1.10% | 887 |
| chr10 | 1594260 | 1.19% | 896 |
| chr11 | 1979459 | 1.47% | 1114 |
| chr12 | 1968649 | 1.48% | 1069 |
| chr13 | 792220 | 0.69% | 411 |
| chr14 | 1209030 | 1.13% | 670 |
| chr15 | 1257455 | 1.23% | 716 |
| chr16 | 1477775 | 1.64% | 865 |
| chr17 | 2169573 | 2.61% | 1256 |
| chr18 | 677897 | 0.84% | 360 |
| chr19 | 2465916 | 4.21% | 1583 |
| chr20 | 1006933 | 1.56% | 575 |
| chr21 | 351652 | 0.75% | 211 |
| chr22 | 801756 | 1.58% | 496 |
| chrX | 1407851 | 0.90% | 796 |
| chrY | 51890 | 0.09% | 23 |
| 3342 contigs with no values (129077085 bp) | 0 | 0.00% | 0 |
Segment lengths
| segments | min | max | mean | median | |
|---|---|---|---|---|---|
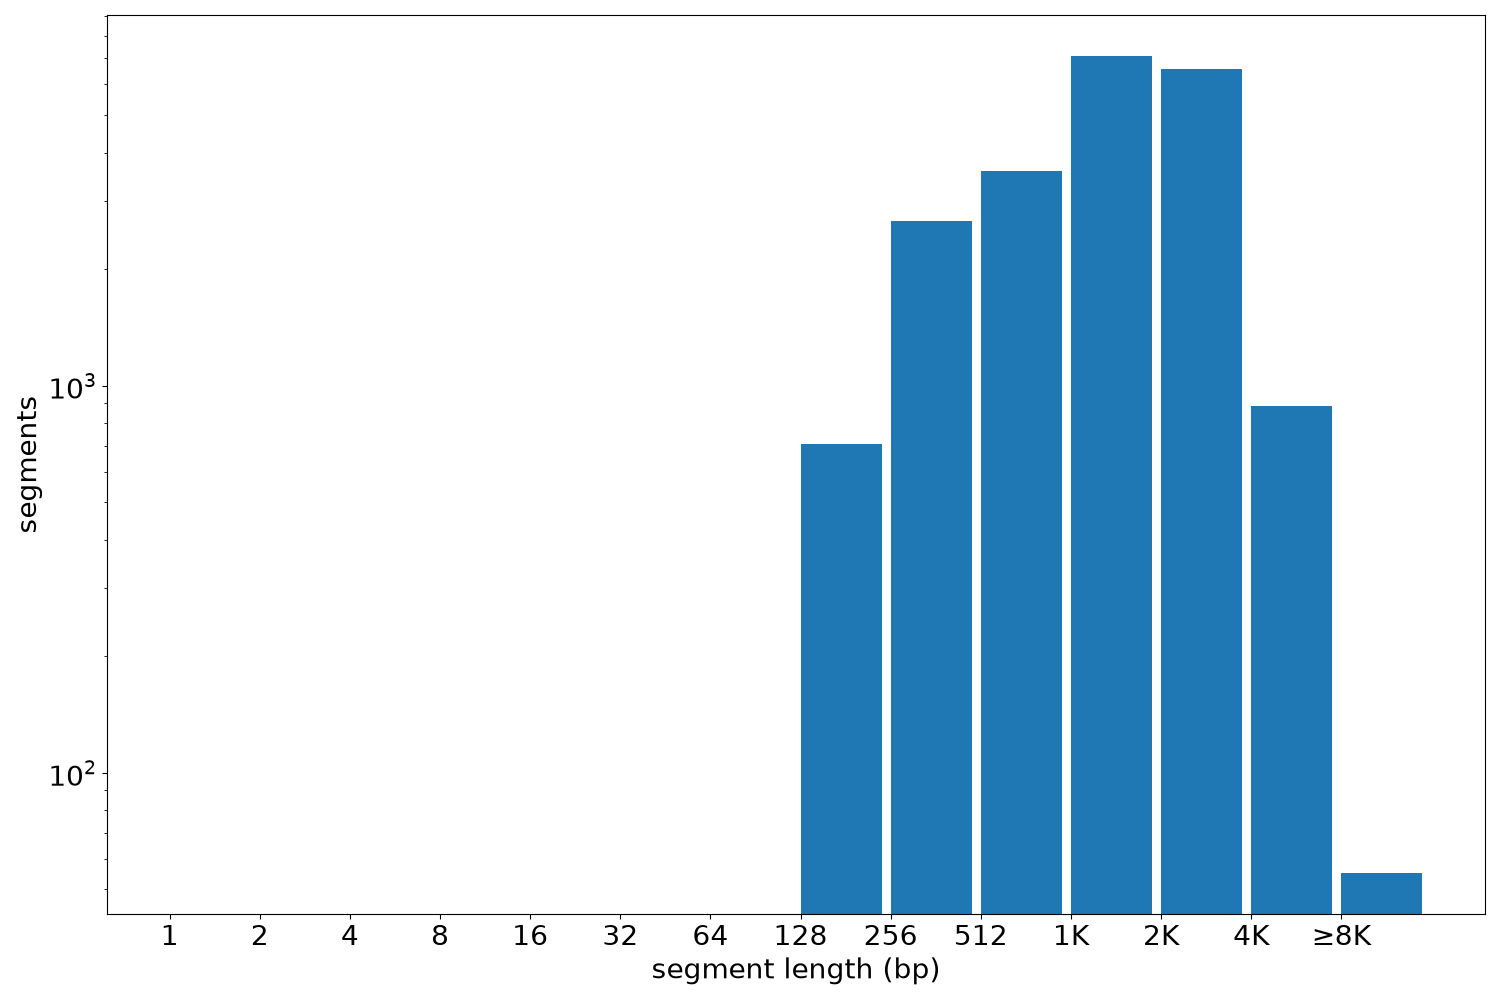
| segments | 21560 | 195 | 43217 | 1760.13 | 1616 |
Files
| Filename | Size | md5 |
|---|---|---|
| ENCFF867WVM.bed.gz | 638.14 KB | 708900209801727ac8a4446157c0f340 |
| ENCFF867WVM.tabix.bed.gz | 260.88 KB | 8436de04520f749a0fd0192f1757d4b9 |
| ENCFF867WVM.tabix.bed.gz.tbi | 143.78 KB | cf78d557839a6a551bf3c69934ebc9ca |
| genomic_resource.yaml | 4.19 KB | 37d3acd4e780d0d76740fe2fe89f3f6c |
| statistics/ |