Resource
| Id | Histone_ChIP-seq/ENCSR962AKF |
|---|---|
| Type | position_score |
| Version | 0 |
| Summary | Histone_ChIP-seq ENCSR962AKF [biosample_summary="Homo sapiens CD8-positive, alpha-beta memory T cell" and target="H3K4me3"] |
| Description |
status: released biological_replicates: Rep 1, Rep 2 summary: output_type: pseudoreplicated peaks audit_internal_action: Released analysis {ENCAN181IFK|/analyses/ENCAN181IFK/} has in progress subobject quality standard {encode4-histone-chip|/quality-standards/encode4-histone-chip/} audit_warning: PBC1 (PCR Bottlenecking Coefficient 1, M1/M_distinct) is the ratio of the number of genomic locations where exactly one read maps uniquely (M1) to the number of genomic locations where some reads map (M_distinct). A PBC1 value in the range 0 - 0.5 is severe bottlenecking, 0.5 - 0.8 is moderate bottlenecking, 0.8 - 0.9 is mild bottlenecking, and > 0.9 is no bottlenecking. PBC1 value > 0.9 is recommended, but > 0.8 is acceptable. ENCODE processed redacted alignments file {ENCFF087KRI|/files/ENCFF087KRI/} processed by ChIP-seq ENCODE4 v1.7.0 GRCh38 pipeline was generated from a library with PBC1 value of 0.87. audit_warning: PBC2 (PCR Bottlenecking Coefficient 2, M1/M2) is the ratio of the number of genomic locations where exactly one read maps uniquely (M1) to the number of genomic locations where two reads map uniquely (M2). A PBC2 value in the range 0 - 1 is severe bottlenecking, 1 - 3 is moderate bottlenecking, 3 - 10 is mild bottlenecking, > 10 is no bottlenecking. PBC2 value > 10 is recommended, but > 3 is acceptable. ENCODE processed redacted alignments file {ENCFF087KRI|/files/ENCFF087KRI/} processed by ChIP-seq ENCODE4 v1.7.0 GRCh38 pipeline was generated from a library with PBC2 value of 7.59. |
| Labels |
|
Scores (1)
| ID | Type | Default annotation | Description | Histogram | Range | Summary |
|---|---|---|---|---|---|---|
| Histone_ChIP-seq_ENCSR962AKF | float |
Histone_ChIP-seq_ENCSR962AKF |
Histone_ChIP-seq ENCSR962AKF [biosample_summary="Homo sapiens CD8-positive, alpha-beta memory T cell" and target="H3K4me3"]
|
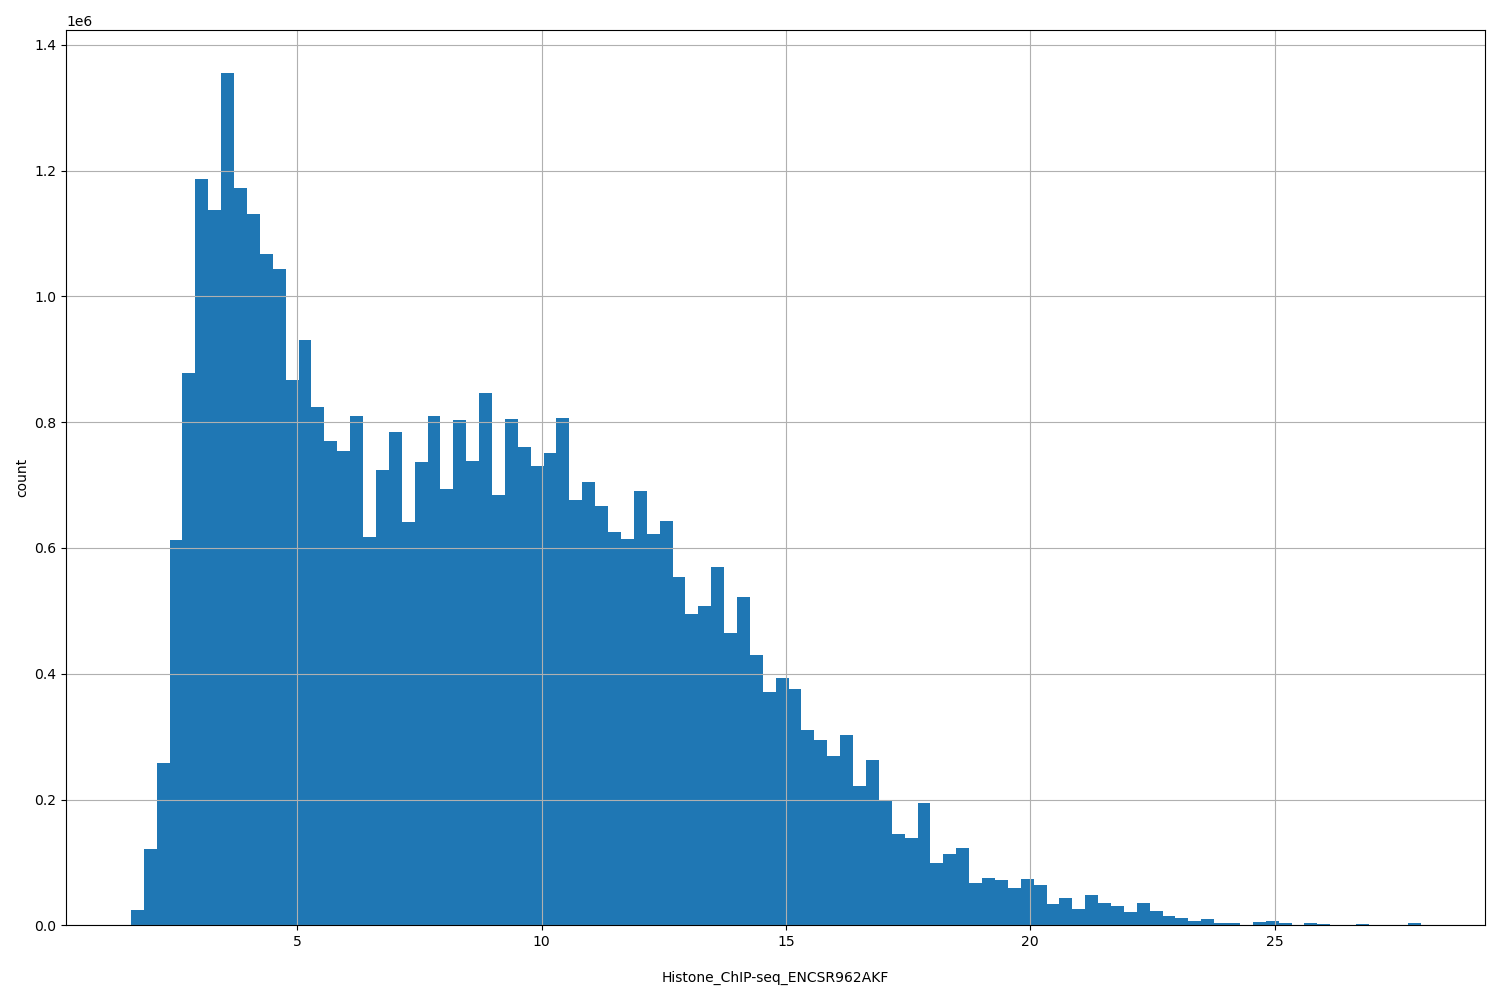 |
[1.59, 28] |
|
n counts base pairs; sd is the population standard deviation.
Coverage
| Chromosome | Covered positions | Covered % | Segments |
|---|---|---|---|
| all chromosomes | 40263036 | 1.25% | 34690 |
| chr1 | 4152580 | 1.67% | 3465 |
| chr2 | 2883724 | 1.19% | 2495 |
| chr3 | 2252075 | 1.14% | 1939 |
| chr4 | 1402888 | 0.74% | 1212 |
| chr5 | 1882710 | 1.04% | 1545 |
| chr6 | 2443767 | 1.43% | 2011 |
| chr7 | 1819908 | 1.14% | 1624 |
| chr8 | 1361899 | 0.94% | 1225 |
| chr9 | 1516293 | 1.10% | 1341 |
| chr10 | 1704364 | 1.27% | 1489 |
| chr11 | 2180151 | 1.61% | 1777 |
| chr12 | 2189070 | 1.64% | 1878 |
| chr13 | 848166 | 0.74% | 737 |
| chr14 | 1549542 | 1.45% | 1314 |
| chr15 | 1264950 | 1.24% | 1091 |
| chr16 | 1547996 | 1.71% | 1355 |
| chr17 | 2383724 | 2.86% | 2033 |
| chr18 | 601654 | 0.75% | 534 |
| chr19 | 2686029 | 4.58% | 2416 |
| chr20 | 1029077 | 1.60% | 900 |
| chr21 | 432401 | 0.93% | 408 |
| chr22 | 956567 | 1.88% | 835 |
| chrX | 1119315 | 0.72% | 1016 |
| chrY | 54186 | 0.09% | 50 |
| 3342 contigs with no values (129077085 bp) | 0 | 0.00% | 0 |
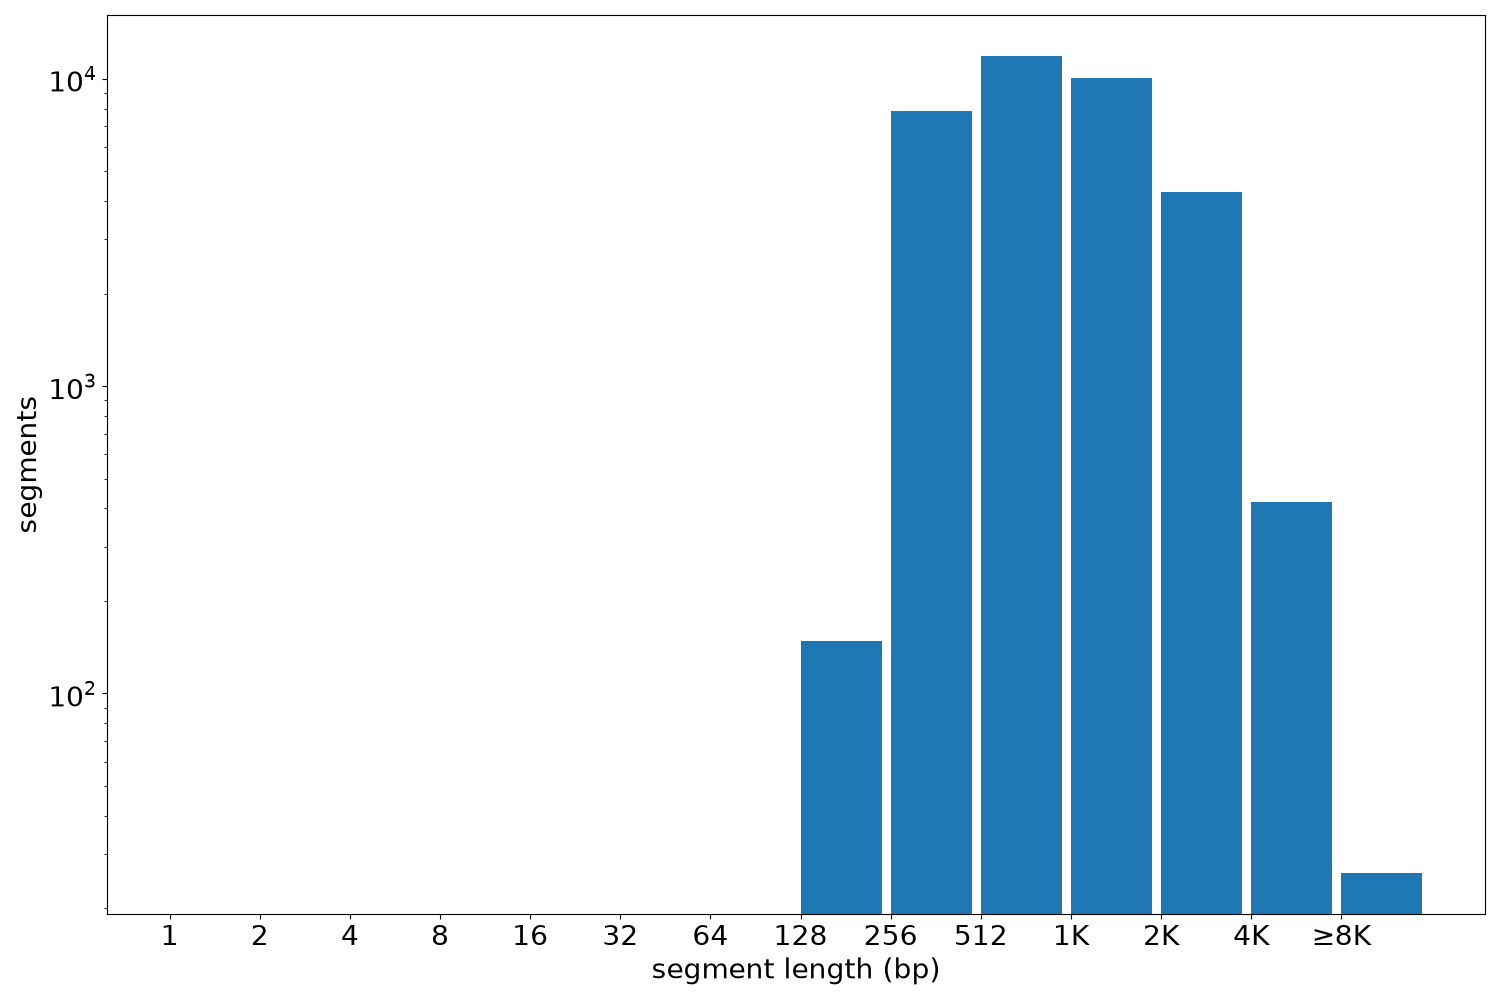
Segment lengths
| segments | min | max | mean | median | |
|---|---|---|---|---|---|
| segments | 34690 | 235 | 15991 | 1160.65 | 879 |
Files
| Filename | Size | md5 |
|---|---|---|
| ENCFF986IXN.bed.gz | 892.62 KB | 97d1602ef512f9c782a641b91a8afba0 |
| ENCFF986IXN.tabix.bed.gz | 388.15 KB | 1e7389fd592c954d2b71e756be602ffe |
| ENCFF986IXN.tabix.bed.gz.tbi | 157.39 KB | 87d9871037e9cf91f94c925941d6a0d0 |
| genomic_resource.yaml | 2.8 KB | c16ddce78538cd00987978d274f45279 |
| statistics/ |