Resource
| Id | Histone_ChIP-seq/ENCSR960EVO |
|---|---|
| Type | position_score |
| Version | 0 |
| Summary | Histone_ChIP-seq ENCSR960EVO [biosample_summary="Homo sapiens aorta tissue female adult (30 years)" and target="H3K4me3"] |
| Description |
status: released biological_replicates: Rep 1 summary: female adult (30 years) output_type: pseudoreplicated peaks audit_internal_action: Released analysis {ENCAN647HVY|/analyses/ENCAN647HVY/} has in progress subobject quality standard {encode4-histone-chip|/quality-standards/encode4-histone-chip/} audit_internal_action: Released analysis {ENCAN647HVY|/analyses/ENCAN647HVY/} has in progress subobject document {f139a3ca-2c2c-4b1e-8e95-cedf65080823|/documents/f139a3ca-2c2c-4b1e-8e95-cedf65080823/} audit_warning: PBC1 (PCR Bottlenecking Coefficient 1, M1/M_distinct) is the ratio of the number of genomic locations where exactly one read maps uniquely (M1) to the number of genomic locations where some reads map (M_distinct). A PBC1 value in the range 0 - 0.5 is severe bottlenecking, 0.5 - 0.8 is moderate bottlenecking, 0.8 - 0.9 is mild bottlenecking, and > 0.9 is no bottlenecking. PBC1 value > 0.9 is recommended, but > 0.8 is acceptable. ENCODE processed alignments file {ENCFF373QKG|/files/ENCFF373QKG/} processed by ChIP-seq ENCODE4 v1.5.1 GRCh38 pipeline was generated from a library with PBC1 value of 0.90. audit_warning: PBC2 (PCR Bottlenecking Coefficient 2, M1/M2) is the ratio of the number of genomic locations where exactly one read maps uniquely (M1) to the number of genomic locations where two reads map uniquely (M2). A PBC2 value in the range 0 - 1 is severe bottlenecking, 1 - 3 is moderate bottlenecking, 3 - 10 is mild bottlenecking, > 10 is no bottlenecking. PBC2 value > 10 is recommended, but > 3 is acceptable. ENCODE processed alignments file {ENCFF373QKG|/files/ENCFF373QKG/} processed by ChIP-seq ENCODE4 v1.5.1 GRCh38 pipeline was generated from a library with PBC2 value of 9.55. |
| Labels |
|
Scores (1)
| ID | Type | Default annotation | Description | Histogram | Range | Summary |
|---|---|---|---|---|---|---|
| Histone_ChIP-seq_ENCSR960EVO | float |
Histone_ChIP-seq_ENCSR960EVO |
Histone_ChIP-seq ENCSR960EVO [biosample_summary="Homo sapiens aorta tissue female adult (30 years)" and target="H3K4me3"]
|
 |
[2.06, 28.7] |
|
n counts base pairs; sd is the population standard deviation.
Coverage
| Chromosome | Covered positions | Covered % | Segments |
|---|---|---|---|
| all chromosomes | 28104936 | 0.87% | 25142 |
| chr1 | 2768678 | 1.11% | 2441 |
| chr2 | 2048720 | 0.85% | 1754 |
| chr3 | 1762056 | 0.89% | 1530 |
| chr4 | 1352285 | 0.71% | 1177 |
| chr5 | 1436897 | 0.79% | 1227 |
| chr6 | 1731857 | 1.01% | 1514 |
| chr7 | 1403290 | 0.88% | 1255 |
| chr8 | 1089942 | 0.75% | 969 |
| chr9 | 1157473 | 0.84% | 1042 |
| chr10 | 1255228 | 0.94% | 1060 |
| chr11 | 1469483 | 1.09% | 1296 |
| chr12 | 1518600 | 1.14% | 1299 |
| chr13 | 642704 | 0.56% | 537 |
| chr14 | 895781 | 0.84% | 784 |
| chr15 | 928700 | 0.91% | 798 |
| chr16 | 987067 | 1.09% | 920 |
| chr17 | 1375644 | 1.65% | 1300 |
| chr18 | 518788 | 0.65% | 444 |
| chr19 | 1488914 | 2.54% | 1600 |
| chr20 | 673703 | 1.05% | 588 |
| chr21 | 266951 | 0.57% | 255 |
| chr22 | 518450 | 1.02% | 485 |
| chrX | 813725 | 0.52% | 867 |
| 3343 contigs with no values (186304500 bp) | 0 | 0.00% | 0 |
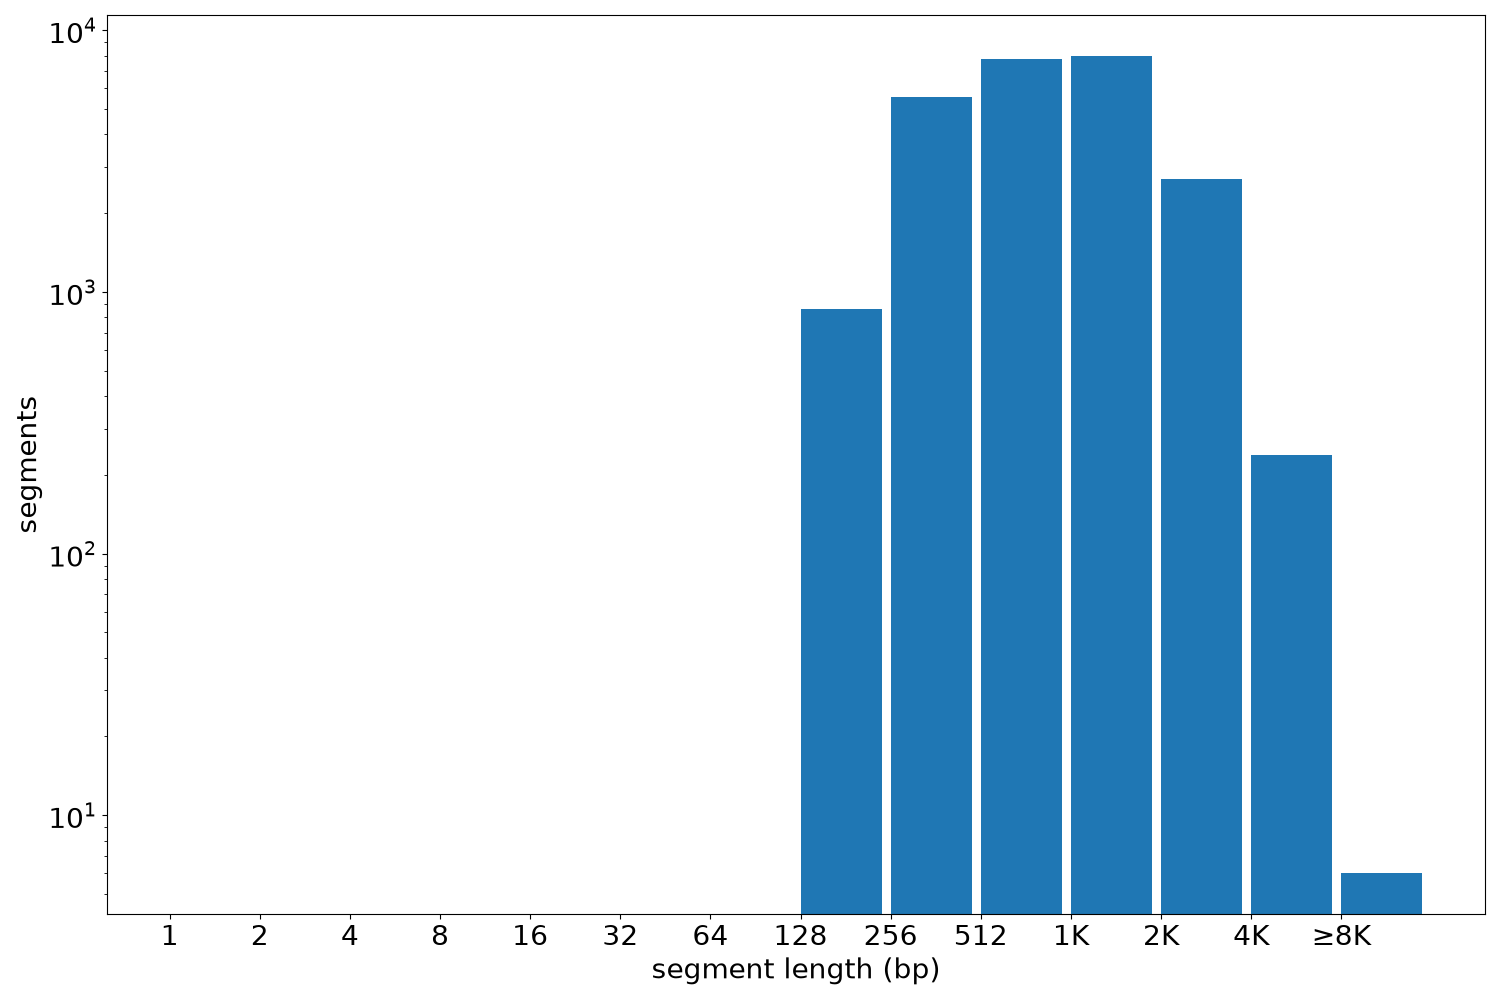
Segment lengths
| segments | min | max | mean | median | |
|---|---|---|---|---|---|
| segments | 25142 | 195 | 10660 | 1117.85 | 892 |
Files
| Filename | Size | md5 |
|---|---|---|
| ENCFF237WYA.bed.gz | 644.08 KB | cea6b2333d45283366b68b3da91967f5 |
| ENCFF237WYA.tabix.bed.gz | 281.85 KB | 0e3398e2d504a6276f32f1803b354a45 |
| ENCFF237WYA.tabix.bed.gz.tbi | 149.75 KB | 30e1d9752de520ccbbb188cd6ad878cf |
| genomic_resource.yaml | 3.16 KB | 2f333658dc737c41e7ebae5bce649274 |
| statistics/ |