Resource
| Id | Histone_ChIP-seq/ENCSR955IXZ |
|---|---|
| Type | position_score |
| Version | 0 |
| Summary | Histone_ChIP-seq ENCSR955IXZ [biosample_summary="Homo sapiens KMS-11" and target="H3K27ac"] |
| Description |
status: released biological_replicates: Rep 1, Rep 2 summary: output_type: pseudoreplicated peaks audit_internal_action: Released analysis {ENCAN157DFN|/analyses/ENCAN157DFN/} has in progress subobject document {9b522814-e30e-4250-9a29-592aa68a45ea|/documents/9b522814-e30e-4250-9a29-592aa68a45ea/} audit_internal_action: Released analysis {ENCAN157DFN|/analyses/ENCAN157DFN/} has in progress subobject quality standard {encode4-histone-chip|/quality-standards/encode4-histone-chip/} audit_warning: PBC1 (PCR Bottlenecking Coefficient 1, M1/M_distinct) is the ratio of the number of genomic locations where exactly one read maps uniquely (M1) to the number of genomic locations where some reads map (M_distinct). A PBC1 value in the range 0 - 0.5 is severe bottlenecking, 0.5 - 0.8 is moderate bottlenecking, 0.8 - 0.9 is mild bottlenecking, and > 0.9 is no bottlenecking. PBC1 value > 0.9 is recommended, but > 0.8 is acceptable. ENCODE processed alignments file {ENCFF433QGW|/files/ENCFF433QGW/} processed by ChIP-seq ENCODE4 v1.6.1 GRCh38 pipeline was generated from a library with PBC1 value of 0.89. audit_warning: PBC2 (PCR Bottlenecking Coefficient 2, M1/M2) is the ratio of the number of genomic locations where exactly one read maps uniquely (M1) to the number of genomic locations where two reads map uniquely (M2). A PBC2 value in the range 0 - 1 is severe bottlenecking, 1 - 3 is moderate bottlenecking, 3 - 10 is mild bottlenecking, > 10 is no bottlenecking. PBC2 value > 10 is recommended, but > 3 is acceptable. ENCODE processed alignments file {ENCFF433QGW|/files/ENCFF433QGW/} processed by ChIP-seq ENCODE4 v1.6.1 GRCh38 pipeline was generated from a library with PBC2 value of 9.92. audit_warning: PBC1 (PCR Bottlenecking Coefficient 1, M1/M_distinct) is the ratio of the number of genomic locations where exactly one read maps uniquely (M1) to the number of genomic locations where some reads map (M_distinct). A PBC1 value in the range 0 - 0.5 is severe bottlenecking, 0.5 - 0.8 is moderate bottlenecking, 0.8 - 0.9 is mild bottlenecking, and > 0.9 is no bottlenecking. PBC1 value > 0.9 is recommended, but > 0.8 is acceptable. ENCODE processed alignments file {ENCFF028BMC|/files/ENCFF028BMC/} processed by ChIP-seq ENCODE4 v1.6.1 GRCh38 pipeline was generated from a library with PBC1 value of 0.82. audit_warning: PBC2 (PCR Bottlenecking Coefficient 2, M1/M2) is the ratio of the number of genomic locations where exactly one read maps uniquely (M1) to the number of genomic locations where two reads map uniquely (M2). A PBC2 value in the range 0 - 1 is severe bottlenecking, 1 - 3 is moderate bottlenecking, 3 - 10 is mild bottlenecking, > 10 is no bottlenecking. PBC2 value > 10 is recommended, but > 3 is acceptable. ENCODE processed alignments file {ENCFF028BMC|/files/ENCFF028BMC/} processed by ChIP-seq ENCODE4 v1.6.1 GRCh38 pipeline was generated from a library with PBC2 value of 5.25. |
| Labels |
|
Scores (1)
| ID | Type | Default annotation | Description | Histogram | Range | Summary |
|---|---|---|---|---|---|---|
| Histone_ChIP-seq_ENCSR955IXZ | float |
Histone_ChIP-seq_ENCSR955IXZ |
Histone_ChIP-seq ENCSR955IXZ [biosample_summary="Homo sapiens KMS-11" and target="H3K27ac"]
|
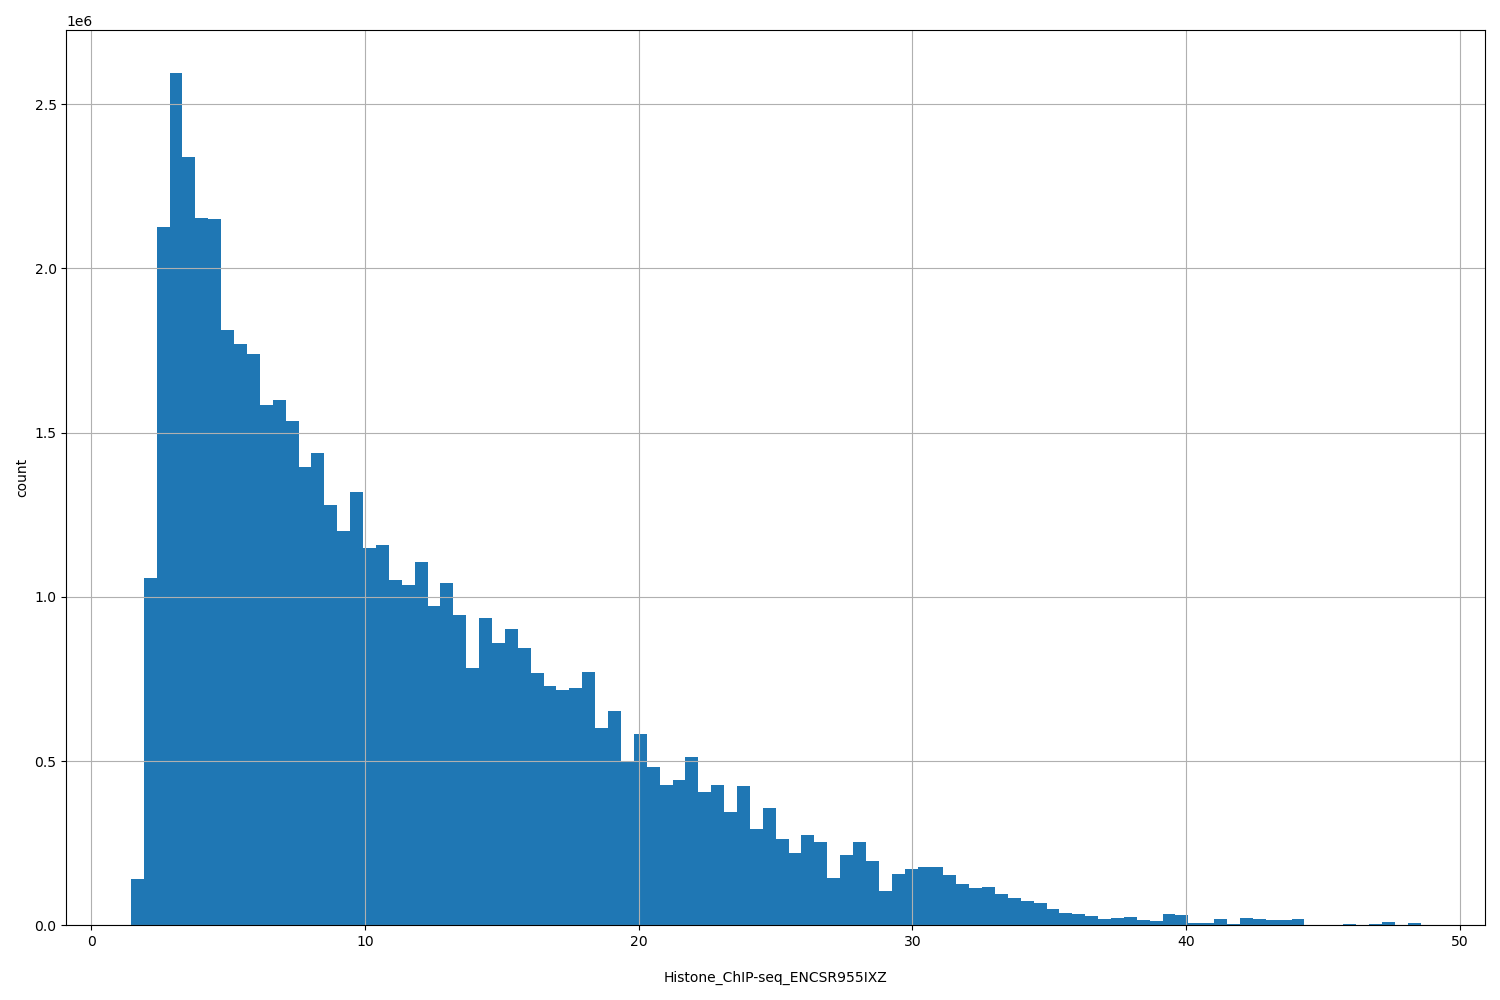 |
[1.45, 48.6] |
|
n counts base pairs; sd is the population standard deviation.
Coverage
| Chromosome | Covered positions | Covered % | Segments |
|---|---|---|---|
| all chromosomes | 56087651 | 1.74% | 35042 |
| chr1 | 5287769 | 2.12% | 3298 |
| chr2 | 4525902 | 1.87% | 2770 |
| chr3 | 3397073 | 1.71% | 2111 |
| chr4 | 2806952 | 1.48% | 1746 |
| chr5 | 3341665 | 1.84% | 1959 |
| chr6 | 3578210 | 2.09% | 2119 |
| chr7 | 3279081 | 2.06% | 1979 |
| chr8 | 2715896 | 1.87% | 1650 |
| chr9 | 2335803 | 1.69% | 1483 |
| chr10 | 2525739 | 1.89% | 1552 |
| chr11 | 2599541 | 1.92% | 1649 |
| chr12 | 2832489 | 2.13% | 1776 |
| chr13 | 1076124 | 0.94% | 740 |
| chr14 | 1664567 | 1.56% | 1085 |
| chr15 | 1879034 | 1.84% | 1168 |
| chr16 | 1768382 | 1.96% | 1209 |
| chr17 | 2649329 | 3.18% | 1612 |
| chr18 | 1424923 | 1.77% | 858 |
| chr19 | 1477856 | 2.52% | 1171 |
| chr20 | 1557180 | 2.42% | 949 |
| chr21 | 574100 | 1.23% | 387 |
| chr22 | 1015994 | 2.00% | 645 |
| chrX | 1774042 | 1.14% | 1126 |
| 3343 contigs with no values (186304500 bp) | 0 | 0.00% | 0 |
Segment lengths
| segments | min | max | mean | median | |
|---|---|---|---|---|---|
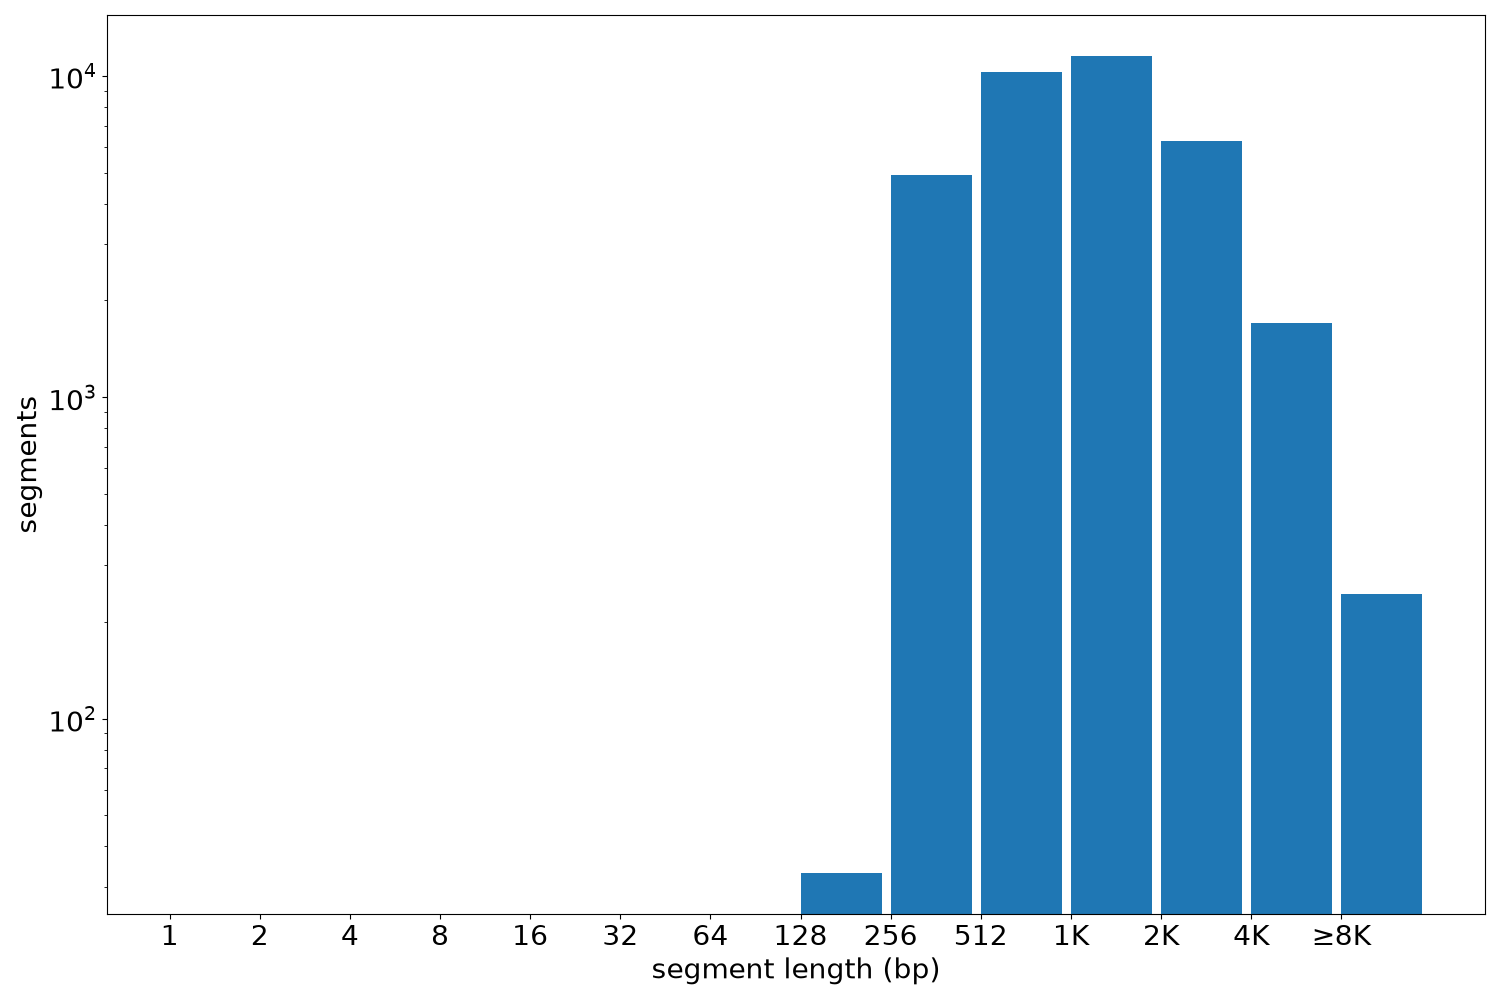
| segments | 35042 | 227 | 25931 | 1600.58 | 1170 |
Files
| Filename | Size | md5 |
|---|---|---|
| ENCFF798EKP.bed.gz | 961.46 KB | 137ae1a067250201678b99a6d7f22399 |
| ENCFF798EKP.tabix.bed.gz | 404.72 KB | 0b1813dcb48e4bce25ffe1222112ad7b |
| ENCFF798EKP.tabix.bed.gz.tbi | 186.35 KB | def37380fb18b3f29a7c2c00ec796ad1 |
| genomic_resource.yaml | 4.22 KB | 0033e87995acc1e2926019bda0bfcb50 |
| statistics/ |