Resource
| Id | Histone_ChIP-seq/ENCSR939RLS |
|---|---|
| Type | position_score |
| Version | 0 |
| Summary | Histone_ChIP-seq ENCSR939RLS [biosample_summary="Homo sapiens thoracic aorta tissue male adult (37 years)" and target="H3K27me3"] |
| Description |
status: released biological_replicates: Rep 1, Rep 2 summary: male adult (37 years) output_type: replicated peaks audit_internal_action: Archived analysis {ENCAN007ITH|/analyses/ENCAN007ITH/} has in progress subobject quality standard {encode3-histone-chip|/quality-standards/encode3-histone-chip/} audit_not_compliant: Processed alignments file {ENCFF334HSI|/files/ENCFF334HSI/} processed by ChIP-seq ENCODE3 hg19 pipeline has 25409712 usable fragments. The minimum ENCODE standard for each replicate in a ChIP-seq experiment targeting H3K27me3-human and investigated as a broad histone mark is 20 million usable fragments. The recommended value is > 45 million, but > 35 million is acceptable. (See {ENCODE ChIP-seq data standards|/data-standards/chip-seq/}) audit_not_compliant: Processed alignments file {ENCFF574MYW|/files/ENCFF574MYW/} processed by ChIP-seq ENCODE3 hg19 pipeline has 27401238 usable fragments. The minimum ENCODE standard for each replicate in a ChIP-seq experiment targeting H3K27me3-human and investigated as a broad histone mark is 20 million usable fragments. The recommended value is > 45 million, but > 35 million is acceptable. (See {ENCODE ChIP-seq data standards|/data-standards/chip-seq/}) audit_warning: PBC1 (PCR Bottlenecking Coefficient 1, M1/M_distinct) is the ratio of the number of genomic locations where exactly one read maps uniquely (M1) to the number of genomic locations where some reads map (M_distinct). A PBC1 value in the range 0 - 0.5 is severe bottlenecking, 0.5 - 0.8 is moderate bottlenecking, 0.8 - 0.9 is mild bottlenecking, and > 0.9 is no bottlenecking. PBC1 value > 0.9 is recommended, but > 0.8 is acceptable. ENCODE processed alignments file {ENCFF574MYW|/files/ENCFF574MYW/} processed by ChIP-seq ENCODE3 hg19 pipeline was generated from a library with PBC1 value of 0.87. audit_warning: PBC2 (PCR Bottlenecking Coefficient 2, M1/M2) is the ratio of the number of genomic locations where exactly one read maps uniquely (M1) to the number of genomic locations where two reads map uniquely (M2). A PBC2 value in the range 0 - 1 is severe bottlenecking, 1 - 3 is moderate bottlenecking, 3 - 10 is mild bottlenecking, > 10 is no bottlenecking. PBC2 value > 10 is recommended, but > 3 is acceptable. ENCODE processed alignments file {ENCFF574MYW|/files/ENCFF574MYW/} processed by ChIP-seq ENCODE3 hg19 pipeline was generated from a library with PBC2 value of 7.82. |
| Labels |
|
Scores (1)
| ID | Type | Default annotation | Description | Histogram | Range | Summary |
|---|---|---|---|---|---|---|
| Histone_ChIP-seq_ENCSR939RLS | float |
Histone_ChIP-seq_ENCSR939RLS |
Histone_ChIP-seq ENCSR939RLS [biosample_summary="Homo sapiens thoracic aorta tissue male adult (37 years)" and target="H3K27me3"]
|
 |
[1.31, 9.23] |
|
n counts base pairs; sd is the population standard deviation.
Coverage
| Chromosome | Covered positions | Covered % | Segments |
|---|---|---|---|
| all chromosomes | 3509550 | 0.11% | 5326 |
| chr1 | 326931 | 0.13% | 526 |
| chr2 | 289683 | 0.12% | 433 |
| chr3 | 148820 | 0.08% | 226 |
| chr4 | 127660 | 0.07% | 198 |
| chr5 | 181421 | 0.10% | 261 |
| chr6 | 270111 | 0.16% | 394 |
| chr7 | 232974 | 0.15% | 322 |
| chr8 | 123593 | 0.09% | 195 |
| chr9 | 176812 | 0.13% | 257 |
| chr10 | 176874 | 0.13% | 268 |
| chr11 | 147976 | 0.11% | 242 |
| chr12 | 143384 | 0.11% | 219 |
| chr13 | 97538 | 0.09% | 143 |
| chr14 | 109533 | 0.10% | 160 |
| chr15 | 119096 | 0.12% | 171 |
| chr16 | 101945 | 0.11% | 172 |
| chr17 | 255619 | 0.31% | 367 |
| chr18 | 45741 | 0.06% | 76 |
| chr19 | 226950 | 0.39% | 355 |
| chr20 | 113826 | 0.18% | 187 |
| chr21 | 33534 | 0.07% | 49 |
| chr22 | 55181 | 0.11% | 97 |
| chrM | 3132 | 18.90% | 5 |
| chrX | 1216 | <0.01% | 3 |
| 3342 contigs with no values (186287931 bp) | 0 | 0.00% | 0 |
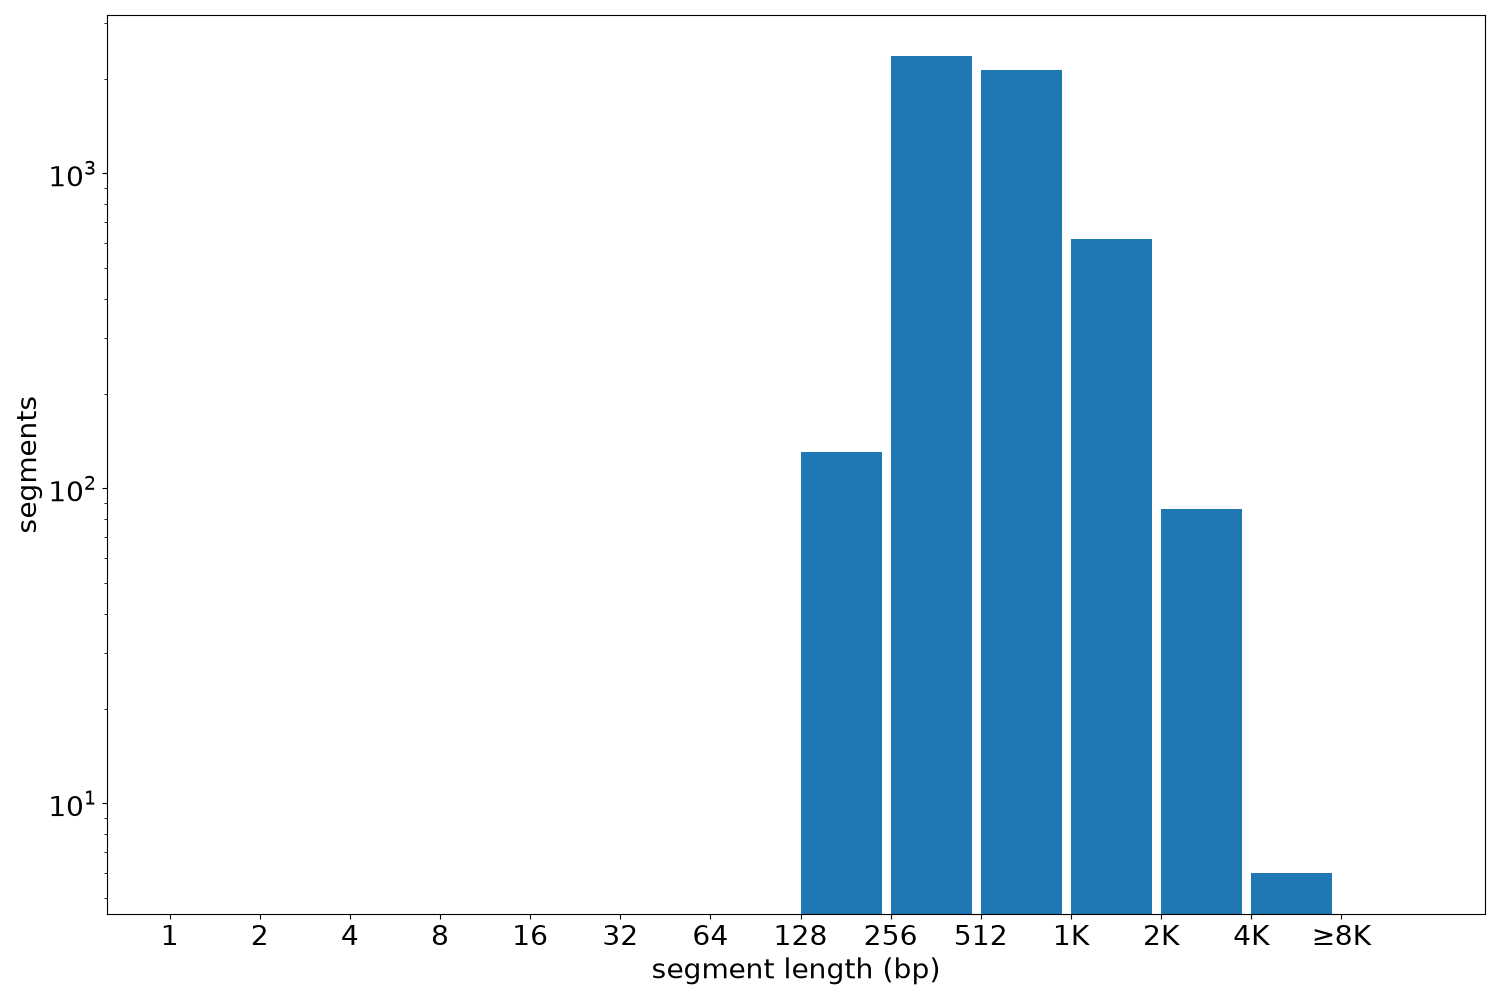
Segment lengths
| segments | min | max | mean | median | |
|---|---|---|---|---|---|
| segments | 5326 | 205 | 5211 | 658.95 | 535.5 |
Files
| Filename | Size | md5 |
|---|---|---|
| ENCFF353HTX.bed.gz | 103.28 KB | 186ded290da4c493a6dfeb15eb0d9324 |
| ENCFF353HTX.tabix.bed.gz | 54.23 KB | c3c55047914795f341a50019b4ff6703 |
| ENCFF353HTX.tabix.bed.gz.tbi | 33.72 KB | 7da03973682ad7f6255c9a68bc53787a |
| genomic_resource.yaml | 3.72 KB | 9a7c20fc087d83abc4944ba67333f8d7 |
| statistics/ |