Resource
| Id | Histone_ChIP-seq/ENCSR935EPK |
|---|---|
| Type | position_score |
| Version | 0 |
| Summary | Histone_ChIP-seq ENCSR935EPK [biosample_summary="Homo sapiens with mild cognitive impairment; dorsolateral prefrontal cortex tissue female adult (87 years)" and target="H3K4me3"] |
| Description |
status: released biological_replicates: Rep 1 summary: female adult (87 years) with mild cognitive impairment output_type: pseudoreplicated peaks audit_internal_action: Released analysis {ENCAN100DZR|/analyses/ENCAN100DZR/} has in progress subobject quality standard {encode4-histone-chip|/quality-standards/encode4-histone-chip/} audit_warning: PBC1 (PCR Bottlenecking Coefficient 1, M1/M_distinct) is the ratio of the number of genomic locations where exactly one read maps uniquely (M1) to the number of genomic locations where some reads map (M_distinct). A PBC1 value in the range 0 - 0.5 is severe bottlenecking, 0.5 - 0.8 is moderate bottlenecking, 0.8 - 0.9 is mild bottlenecking, and > 0.9 is no bottlenecking. PBC1 value > 0.9 is recommended, but > 0.8 is acceptable. ENCODE processed alignments file {ENCFF331TRV|/files/ENCFF331TRV/} processed by ChIP-seq ENCODE4 v1.8.0 GRCh38 pipeline was generated from a library with PBC1 value of 0.88. audit_warning: PBC2 (PCR Bottlenecking Coefficient 2, M1/M2) is the ratio of the number of genomic locations where exactly one read maps uniquely (M1) to the number of genomic locations where two reads map uniquely (M2). A PBC2 value in the range 0 - 1 is severe bottlenecking, 1 - 3 is moderate bottlenecking, 3 - 10 is mild bottlenecking, > 10 is no bottlenecking. PBC2 value > 10 is recommended, but > 3 is acceptable. ENCODE processed alignments file {ENCFF331TRV|/files/ENCFF331TRV/} processed by ChIP-seq ENCODE4 v1.8.0 GRCh38 pipeline was generated from a library with PBC2 value of 9.00. |
| Labels |
|
Scores (1)
| ID | Type | Default annotation | Description | Histogram | Range | Summary |
|---|---|---|---|---|---|---|
| Histone_ChIP-seq_ENCSR935EPK | float |
Histone_ChIP-seq_ENCSR935EPK |
Histone_ChIP-seq ENCSR935EPK [biosample_summary="Homo sapiens with mild cognitive impairment; dorsolateral prefrontal cortex tissue female adult (87 years)" and target="H3K4me3"]
|
 |
[1.76, 86.6] |
|
n counts base pairs; sd is the population standard deviation.
Coverage
| Chromosome | Covered positions | Covered % | Segments |
|---|---|---|---|
| all chromosomes | 70592099 | 2.19% | 39394 |
| chr1 | 6755946 | 2.71% | 3676 |
| chr2 | 5073114 | 2.09% | 2890 |
| chr3 | 4314755 | 2.18% | 2355 |
| chr4 | 3048421 | 1.60% | 1764 |
| chr5 | 3682177 | 2.03% | 2064 |
| chr6 | 4193992 | 2.46% | 2360 |
| chr7 | 3483758 | 2.19% | 2033 |
| chr8 | 2831183 | 1.95% | 1629 |
| chr9 | 2901579 | 2.10% | 1677 |
| chr10 | 3128296 | 2.34% | 1816 |
| chr11 | 3703589 | 2.74% | 1928 |
| chr12 | 3749079 | 2.81% | 1996 |
| chr13 | 1765411 | 1.54% | 1076 |
| chr14 | 2237956 | 2.09% | 1208 |
| chr15 | 2176677 | 2.13% | 1222 |
| chr16 | 2603272 | 2.88% | 1500 |
| chr17 | 3676050 | 4.42% | 1988 |
| chr18 | 1393961 | 1.73% | 817 |
| chr19 | 3881083 | 6.62% | 2116 |
| chr20 | 1756717 | 2.73% | 981 |
| chr21 | 723988 | 1.55% | 436 |
| chr22 | 1487068 | 2.93% | 795 |
| chrX | 2024027 | 1.30% | 1067 |
| 3343 contigs with no values (186304500 bp) | 0 | 0.00% | 0 |
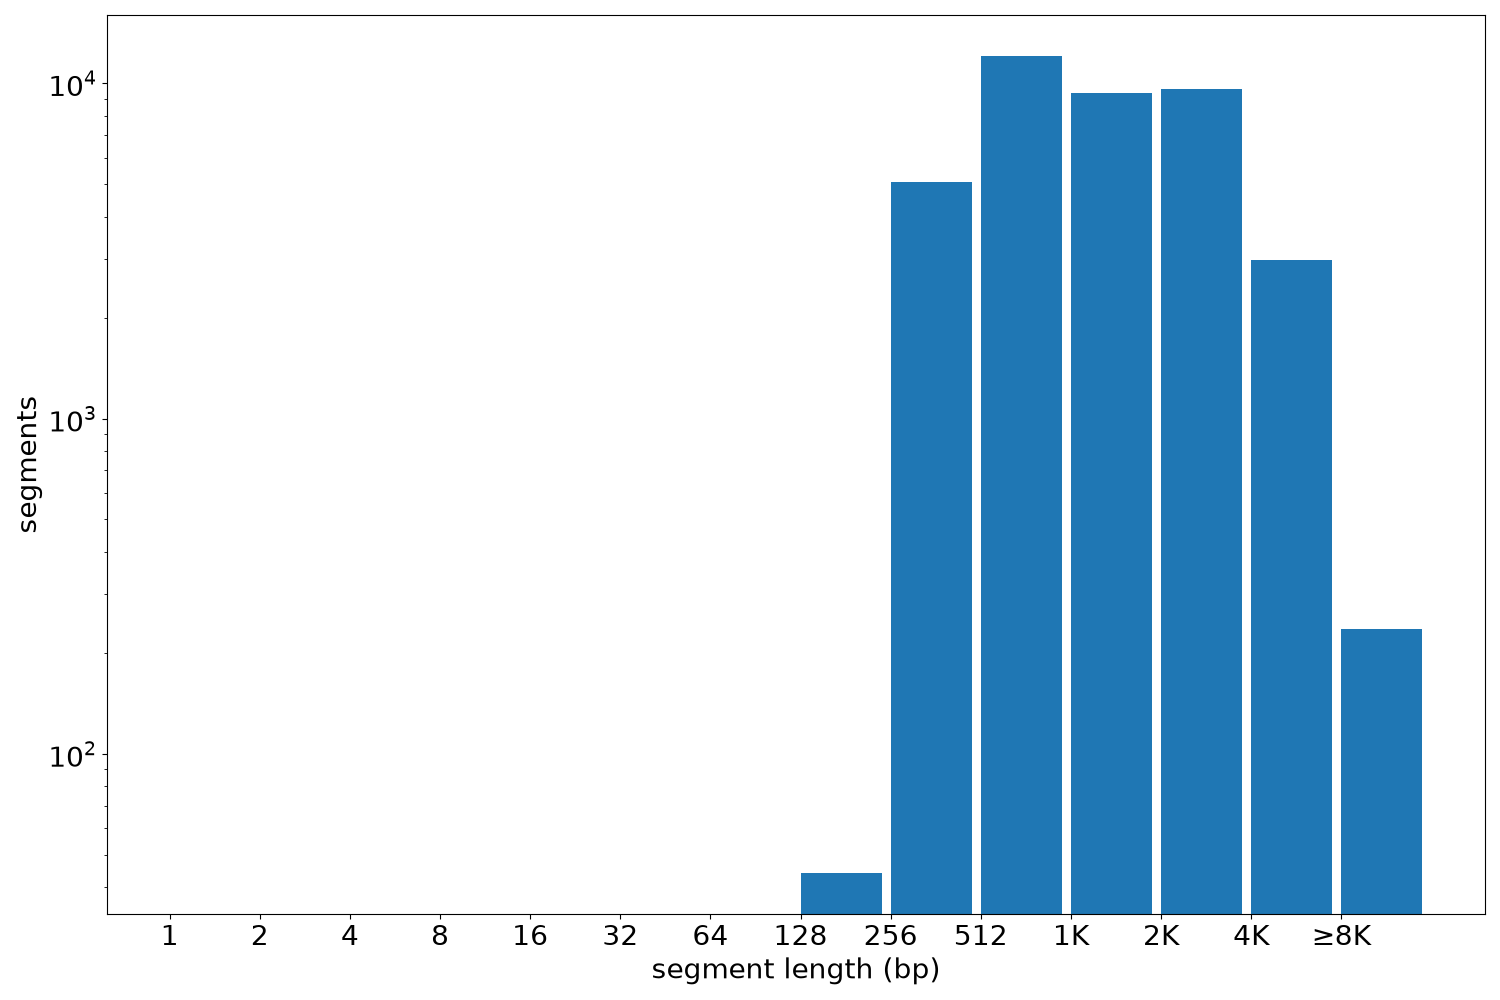
Segment lengths
| segments | min | max | mean | median | |
|---|---|---|---|---|---|
| segments | 39394 | 235 | 35696 | 1791.95 | 1202 |
Files
| Filename | Size | md5 |
|---|---|---|
| ENCFF009QWW.bed.gz | 1005.13 KB | bdffdb37748fc96bcf60e01116d44756 |
| ENCFF009QWW.tabix.bed.gz | 444.21 KB | d4a0467fb9db2d2270b46e44bd88a43c |
| ENCFF009QWW.tabix.bed.gz.tbi | 223.47 KB | 0f6382af501c2e8ed24af7e1e69d00e0 |
| genomic_resource.yaml | 2.99 KB | 83083f12b9b0c6c0429e8d3ba66693b4 |
| statistics/ |