Resource
| Id | Histone_ChIP-seq/ENCSR915QOL |
|---|---|
| Type | position_score |
| Version | 0 |
| Summary | Histone_ChIP-seq ENCSR915QOL [biosample_summary="Homo sapiens fibroblast of lung female child (11 years) and male adult (45 years)" and target="H3K4me3"] |
| Description |
status: released biological_replicates: Rep 1, Rep 2 summary: female child (11 years) male adult (45 years) output_type: pseudoreplicated peaks audit_internal_action: Released analysis {ENCAN061DJJ|/analyses/ENCAN061DJJ/} has in progress subobject quality standard {encode4-histone-chip|/quality-standards/encode4-histone-chip/} audit_internal_action: Released analysis {ENCAN061DJJ|/analyses/ENCAN061DJJ/} has in progress subobject document {1010dfb5-905f-4eb0-abe7-8569a255d5da|/documents/1010dfb5-905f-4eb0-abe7-8569a255d5da/} audit_warning: PBC1 (PCR Bottlenecking Coefficient 1, M1/M_distinct) is the ratio of the number of genomic locations where exactly one read maps uniquely (M1) to the number of genomic locations where some reads map (M_distinct). A PBC1 value in the range 0 - 0.5 is severe bottlenecking, 0.5 - 0.8 is moderate bottlenecking, 0.8 - 0.9 is mild bottlenecking, and > 0.9 is no bottlenecking. PBC1 value > 0.9 is recommended, but > 0.8 is acceptable. ENCODE processed alignments file {ENCFF627LYN|/files/ENCFF627LYN/} processed by ChIP-seq ENCODE4 v1.5.1 GRCh38 pipeline was generated from a library with PBC1 value of 0.89. audit_warning: PBC2 (PCR Bottlenecking Coefficient 2, M1/M2) is the ratio of the number of genomic locations where exactly one read maps uniquely (M1) to the number of genomic locations where two reads map uniquely (M2). A PBC2 value in the range 0 - 1 is severe bottlenecking, 1 - 3 is moderate bottlenecking, 3 - 10 is mild bottlenecking, > 10 is no bottlenecking. PBC2 value > 10 is recommended, but > 3 is acceptable. ENCODE processed alignments file {ENCFF627LYN|/files/ENCFF627LYN/} processed by ChIP-seq ENCODE4 v1.5.1 GRCh38 pipeline was generated from a library with PBC2 value of 9.50. |
| Labels |
|
Scores (1)
| ID | Type | Default annotation | Description | Histogram | Range | Summary |
|---|---|---|---|---|---|---|
| Histone_ChIP-seq_ENCSR915QOL | float |
Histone_ChIP-seq_ENCSR915QOL |
Histone_ChIP-seq ENCSR915QOL [biosample_summary="Homo sapiens fibroblast of lung female child (11 years) and male adult (45 years)" and target="H3K4me3"]
|
 |
[1.8, 23.2] |
|
n counts base pairs; sd is the population standard deviation.
Coverage
| Chromosome | Covered positions | Covered % | Segments |
|---|---|---|---|
| all chromosomes | 32760840 | 1.02% | 27275 |
| chr1 | 3206820 | 1.29% | 2643 |
| chr2 | 2305417 | 0.95% | 1874 |
| chr3 | 1973841 | 1.00% | 1582 |
| chr4 | 1454231 | 0.76% | 1185 |
| chr5 | 1660639 | 0.91% | 1283 |
| chr6 | 2047726 | 1.20% | 1648 |
| chr7 | 1594569 | 1.00% | 1301 |
| chr8 | 1263116 | 0.87% | 1068 |
| chr9 | 1328263 | 0.96% | 1143 |
| chr10 | 1419065 | 1.06% | 1182 |
| chr11 | 1746141 | 1.29% | 1392 |
| chr12 | 1835377 | 1.38% | 1451 |
| chr13 | 711862 | 0.62% | 624 |
| chr14 | 1050589 | 0.98% | 854 |
| chr15 | 1080323 | 1.06% | 882 |
| chr16 | 1224117 | 1.36% | 1074 |
| chr17 | 1813469 | 2.18% | 1568 |
| chr18 | 570473 | 0.71% | 516 |
| chr19 | 1833359 | 3.13% | 1663 |
| chr20 | 767586 | 1.19% | 662 |
| chr21 | 313306 | 0.67% | 276 |
| chr22 | 647357 | 1.27% | 557 |
| chrX | 911547 | 0.58% | 843 |
| chrY | 1647 | <0.01% | 4 |
| 3342 contigs with no values (129077085 bp) | 0 | 0.00% | 0 |
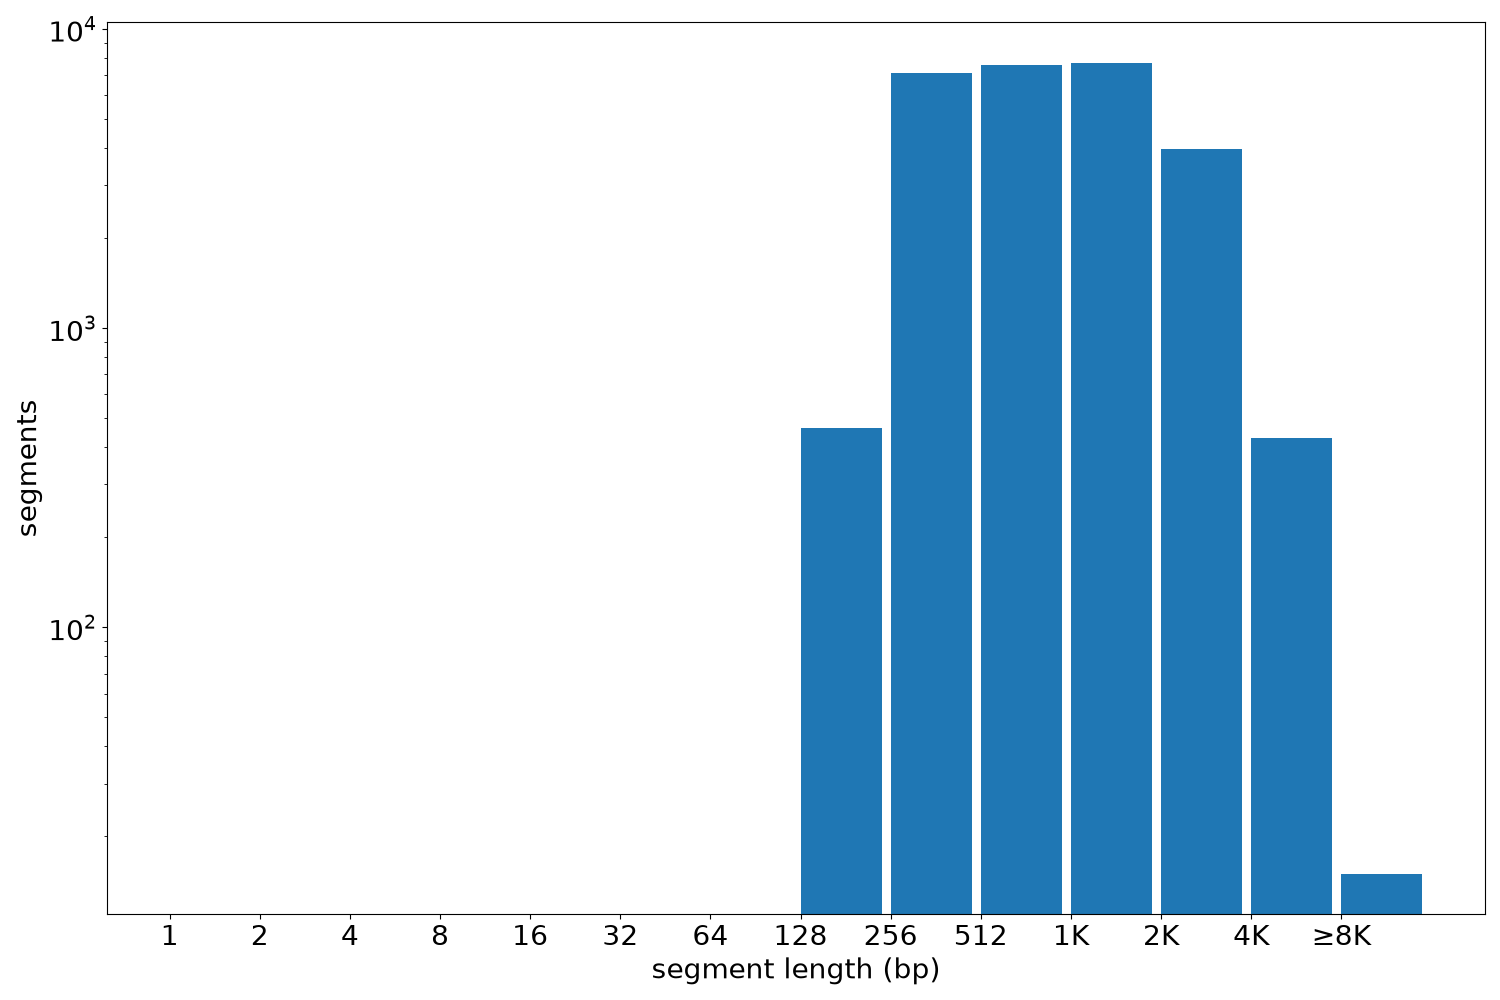
Segment lengths
| segments | min | max | mean | median | |
|---|---|---|---|---|---|
| segments | 27275 | 233 | 18646 | 1201.13 | 879 |
Files
| Filename | Size | md5 |
|---|---|---|
| ENCFF861IJO.bed.gz | 661.67 KB | 577d046f97e786c52c30fec9d32ef417 |
| ENCFF861IJO.tabix.bed.gz | 311.22 KB | 9713fc311c28af02e0dfb74198e3bc3b |
| ENCFF861IJO.tabix.bed.gz.tbi | 149.39 KB | 6c1734cbf3b8226b2fdc2eed93ef67f4 |
| genomic_resource.yaml | 3.18 KB | 713a986c54736ff345866abe6216e3c7 |
| statistics/ |