Resource
| Id | Histone_ChIP-seq/ENCSR874WOB |
|---|---|
| Type | position_score |
| Version | 0 |
| Summary | Histone_ChIP-seq ENCSR874WOB [biosample_summary="Homo sapiens trophoblast cell originated from H1" and target="H3K4me3"] |
| Description |
status: released biological_replicates: Rep 1, Rep 2 summary: male embryo output_type: replicated peaks audit_internal_action: Archived analysis {ENCAN469XKQ|/analyses/ENCAN469XKQ/} has in progress subobject quality standard {encode3-histone-chip|/quality-standards/encode3-histone-chip/} audit_warning: Processed alignments file {ENCFF358JLY|/files/ENCFF358JLY/} processed by ChIP-seq ENCODE3 hg19 pipeline has 19800701 usable fragments. The minimum ENCODE standard for each replicate in a ChIP-seq experiment targeting H3K4me3-human and investigated as a narrow histone mark is 10 million usable fragments. The recommended value is > 20 million, but > 10 million is acceptable. (See {ENCODE ChIP-seq data standards|/data-standards/chip-seq/}) audit_warning: Processed alignments file {ENCFF673HLK|/files/ENCFF673HLK/} processed by ChIP-seq ENCODE3 hg19 pipeline has 17895895 usable fragments. The minimum ENCODE standard for each replicate in a ChIP-seq experiment targeting H3K4me3-human and investigated as a narrow histone mark is 10 million usable fragments. The recommended value is > 20 million, but > 10 million is acceptable. (See {ENCODE ChIP-seq data standards|/data-standards/chip-seq/}) audit_warning: PBC1 (PCR Bottlenecking Coefficient 1, M1/M_distinct) is the ratio of the number of genomic locations where exactly one read maps uniquely (M1) to the number of genomic locations where some reads map (M_distinct). A PBC1 value in the range 0 - 0.5 is severe bottlenecking, 0.5 - 0.8 is moderate bottlenecking, 0.8 - 0.9 is mild bottlenecking, and > 0.9 is no bottlenecking. PBC1 value > 0.9 is recommended, but > 0.8 is acceptable. ENCODE processed alignments file {ENCFF358JLY|/files/ENCFF358JLY/} processed by ChIP-seq ENCODE3 hg19 pipeline was generated from a library with PBC1 value of 0.87. audit_warning: PBC2 (PCR Bottlenecking Coefficient 2, M1/M2) is the ratio of the number of genomic locations where exactly one read maps uniquely (M1) to the number of genomic locations where two reads map uniquely (M2). A PBC2 value in the range 0 - 1 is severe bottlenecking, 1 - 3 is moderate bottlenecking, 3 - 10 is mild bottlenecking, > 10 is no bottlenecking. PBC2 value > 10 is recommended, but > 3 is acceptable. ENCODE processed alignments file {ENCFF358JLY|/files/ENCFF358JLY/} processed by ChIP-seq ENCODE3 hg19 pipeline was generated from a library with PBC2 value of 7.96. |
| Labels |
|
Scores (1)
| ID | Type | Default annotation | Description | Histogram | Range | Summary |
|---|---|---|---|---|---|---|
| Histone_ChIP-seq_ENCSR874WOB | float |
Histone_ChIP-seq_ENCSR874WOB |
Histone_ChIP-seq ENCSR874WOB [biosample_summary="Homo sapiens trophoblast cell originated from H1" and target="H3K4me3"]
|
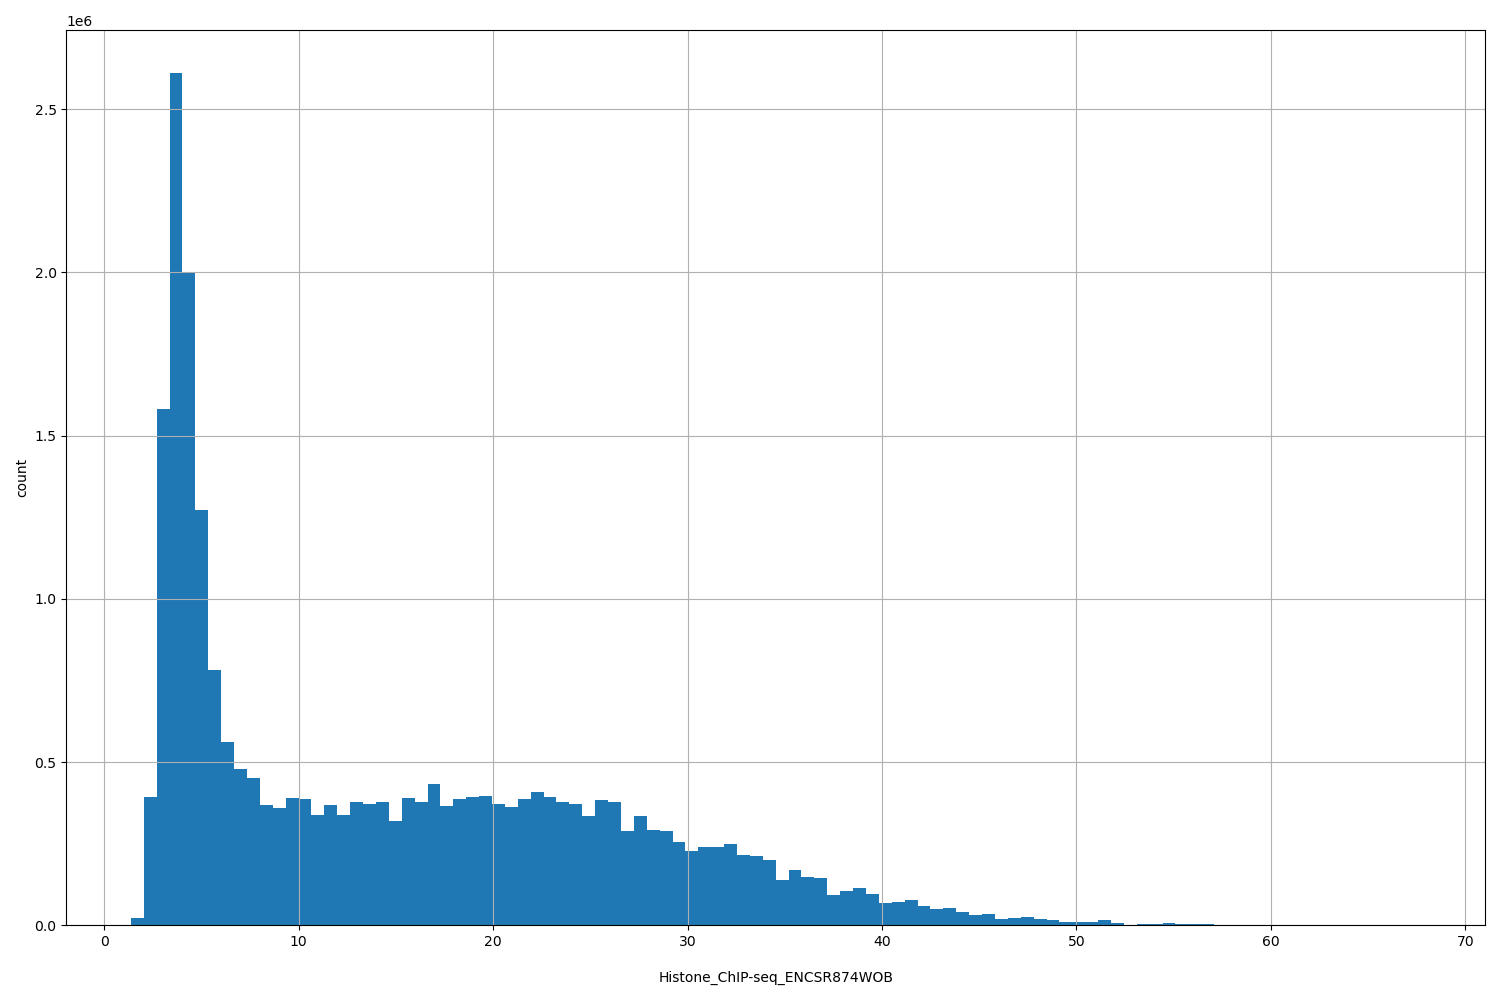 |
[1.36, 67.7] |
|
n counts base pairs; sd is the population standard deviation.
Coverage
| Chromosome | Covered positions | Covered % | Segments |
|---|---|---|---|
| all chromosomes | 25415949 | 0.79% | 52707 |
| chr1 | 2377440 | 0.95% | 4792 |
| chr2 | 1768196 | 0.73% | 3814 |
| chr3 | 1319648 | 0.67% | 2584 |
| chr4 | 1013770 | 0.53% | 2011 |
| chr5 | 1212369 | 0.67% | 2548 |
| chr6 | 1344050 | 0.79% | 2655 |
| chr7 | 1253055 | 0.79% | 2670 |
| chr8 | 1037766 | 0.72% | 2170 |
| chr9 | 1094608 | 0.79% | 2273 |
| chr10 | 1147168 | 0.86% | 2566 |
| chr11 | 1361865 | 1.01% | 2837 |
| chr12 | 1224936 | 0.92% | 2444 |
| chr13 | 549586 | 0.48% | 1157 |
| chr14 | 814306 | 0.76% | 1690 |
| chr15 | 809883 | 0.79% | 1654 |
| chr16 | 1122427 | 1.24% | 2423 |
| chr17 | 1449764 | 1.74% | 2933 |
| chr18 | 488046 | 0.61% | 1063 |
| chr19 | 1649998 | 2.81% | 3347 |
| chr20 | 736268 | 1.14% | 1651 |
| chr21 | 322060 | 0.69% | 766 |
| chr22 | 633569 | 1.25% | 1471 |
| chrX | 655629 | 0.42% | 1130 |
| chrY | 29542 | 0.05% | 58 |
| 3342 contigs with no values (129077085 bp) | 0 | 0.00% | 0 |
Segment lengths
| segments | min | max | mean | median | |
|---|---|---|---|---|---|
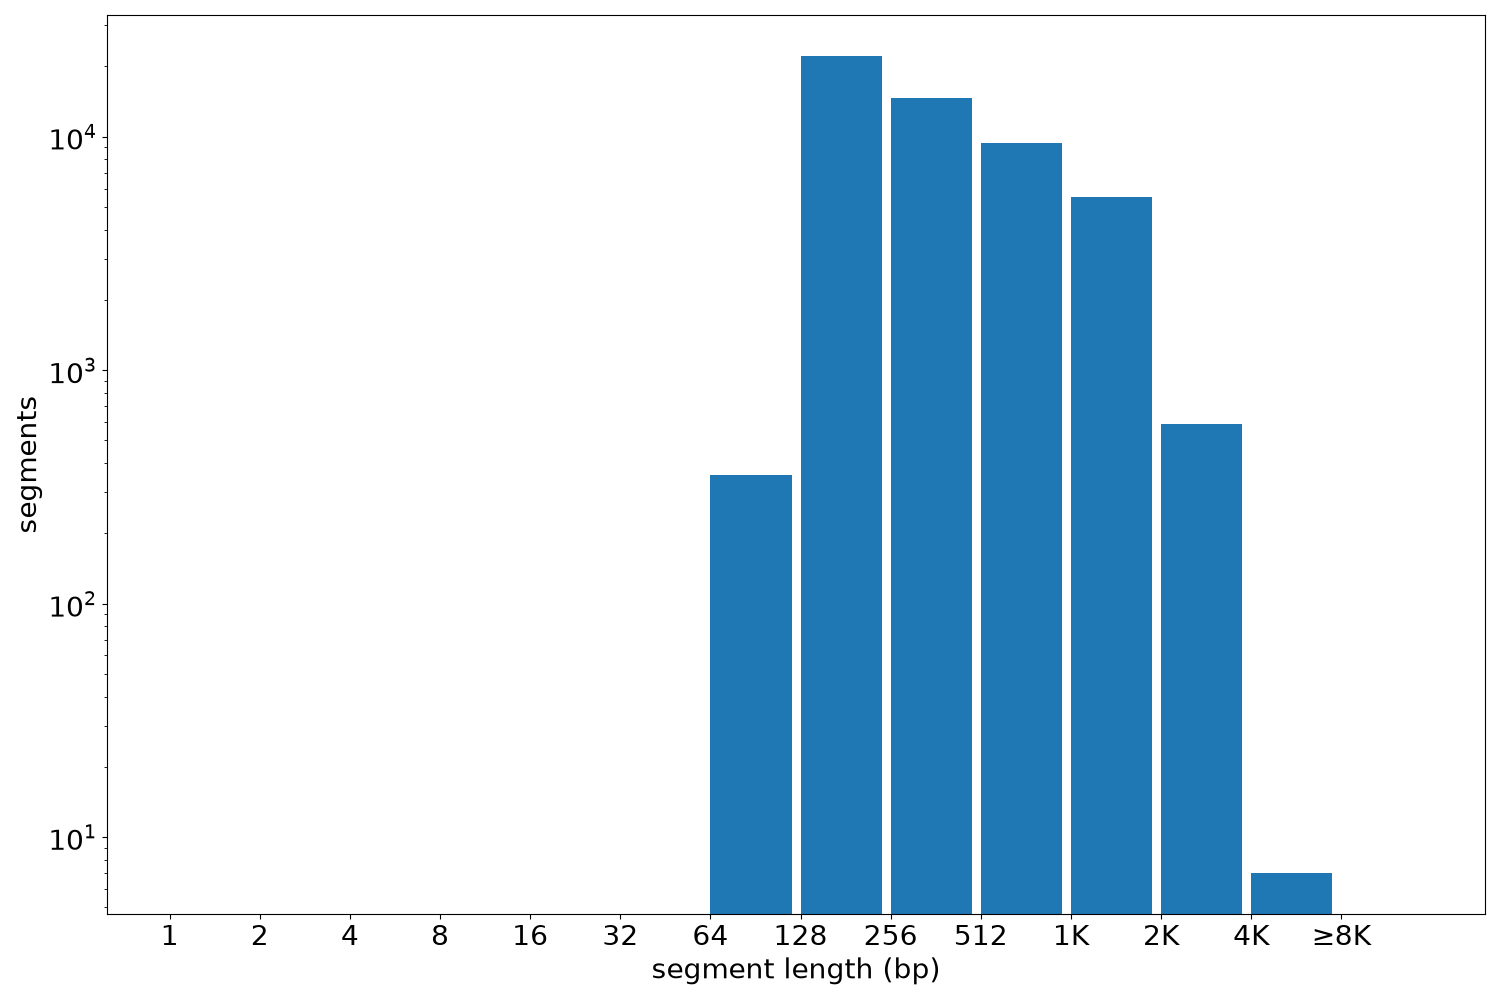
| segments | 52707 | 120 | 5162 | 482.21 | 290 |
Files
| Filename | Size | md5 |
|---|---|---|
| ENCFF514ODP.bed.gz | 1.25 MB | ca49fd0c1d8f42fc2b8bbe2ec1085ec2 |
| ENCFF514ODP.tabix.bed.gz | 563.89 KB | c524865e8f66bea508636d82ec1afb74 |
| ENCFF514ODP.tabix.bed.gz.tbi | 260.65 KB | c33d5a97286c0b760bd65dc6a4af310d |
| genomic_resource.yaml | 3.68 KB | 061af7e73e375779fa41f6f42c1b593f |
| statistics/ |