Resource
| Id | Histone_ChIP-seq/ENCSR869XBX |
|---|---|
| Type | position_score |
| Version | 0 |
| Summary | Histone_ChIP-seq ENCSR869XBX [biosample_summary="Homo sapiens mucosa of descending colon tissue male adult (40 years)" and target="H3K4me3"] |
| Description |
status: released biological_replicates: Rep 1 summary: male adult (40 years) output_type: pseudoreplicated peaks audit_internal_action: Released analysis {ENCAN160ABX|/analyses/ENCAN160ABX/} has in progress subobject quality standard {encode4-histone-chip|/quality-standards/encode4-histone-chip/} audit_warning: PBC1 (PCR Bottlenecking Coefficient 1, M1/M_distinct) is the ratio of the number of genomic locations where exactly one read maps uniquely (M1) to the number of genomic locations where some reads map (M_distinct). A PBC1 value in the range 0 - 0.5 is severe bottlenecking, 0.5 - 0.8 is moderate bottlenecking, 0.8 - 0.9 is mild bottlenecking, and > 0.9 is no bottlenecking. PBC1 value > 0.9 is recommended, but > 0.8 is acceptable. ENCODE processed alignments file {ENCFF265UCI|/files/ENCFF265UCI/} processed by ChIP-seq ENCODE4 v1.8.0 GRCh38 pipeline was generated from a library with PBC1 value of 0.88. audit_warning: PBC2 (PCR Bottlenecking Coefficient 2, M1/M2) is the ratio of the number of genomic locations where exactly one read maps uniquely (M1) to the number of genomic locations where two reads map uniquely (M2). A PBC2 value in the range 0 - 1 is severe bottlenecking, 1 - 3 is moderate bottlenecking, 3 - 10 is mild bottlenecking, > 10 is no bottlenecking. PBC2 value > 10 is recommended, but > 3 is acceptable. ENCODE processed alignments file {ENCFF265UCI|/files/ENCFF265UCI/} processed by ChIP-seq ENCODE4 v1.8.0 GRCh38 pipeline was generated from a library with PBC2 value of 7.52. |
| Labels |
|
Scores (1)
| ID | Type | Default annotation | Description | Histogram | Range | Summary |
|---|---|---|---|---|---|---|
| Histone_ChIP-seq_ENCSR869XBX | float |
Histone_ChIP-seq_ENCSR869XBX |
Histone_ChIP-seq ENCSR869XBX [biosample_summary="Homo sapiens mucosa of descending colon tissue male adult (40 years)" and target="H3K4me3"]
|
 |
[1.76, 33.3] |
|
n counts base pairs; sd is the population standard deviation.
Coverage
| Chromosome | Covered positions | Covered % | Segments |
|---|---|---|---|
| all chromosomes | 16823435 | 0.52% | 14222 |
| chr1 | 1676997 | 0.67% | 1426 |
| chr2 | 1173076 | 0.48% | 935 |
| chr3 | 960769 | 0.48% | 813 |
| chr4 | 684163 | 0.36% | 552 |
| chr5 | 784019 | 0.43% | 634 |
| chr6 | 983052 | 0.58% | 801 |
| chr7 | 828207 | 0.52% | 714 |
| chr8 | 612432 | 0.42% | 501 |
| chr9 | 713924 | 0.52% | 593 |
| chr10 | 706915 | 0.53% | 595 |
| chr11 | 907958 | 0.67% | 745 |
| chr12 | 891338 | 0.67% | 739 |
| chr13 | 340003 | 0.30% | 268 |
| chr14 | 574090 | 0.54% | 472 |
| chr15 | 545150 | 0.53% | 456 |
| chr16 | 711371 | 0.79% | 619 |
| chr17 | 1023823 | 1.23% | 886 |
| chr18 | 272350 | 0.34% | 217 |
| chr19 | 1123132 | 1.92% | 1016 |
| chr20 | 419482 | 0.65% | 363 |
| chr21 | 161825 | 0.35% | 130 |
| chr22 | 360426 | 0.71% | 322 |
| chrX | 354343 | 0.23% | 408 |
| chrY | 14590 | 0.03% | 17 |
| 3342 contigs with no values (129077085 bp) | 0 | 0.00% | 0 |
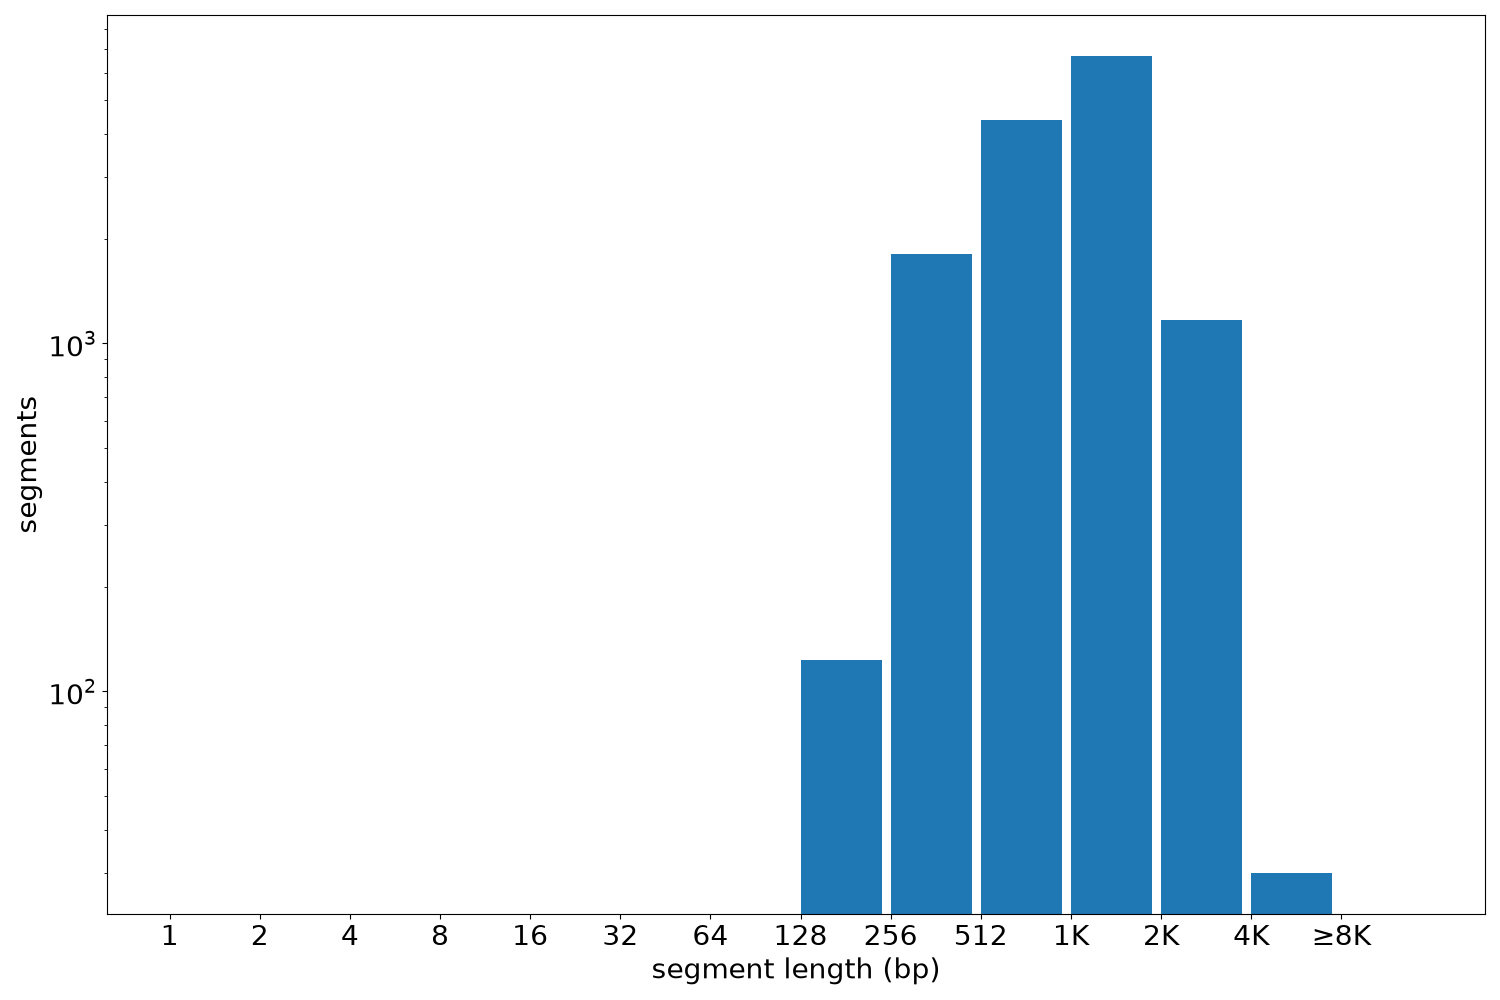
Segment lengths
| segments | min | max | mean | median | |
|---|---|---|---|---|---|
| segments | 14222 | 205 | 7665 | 1182.92 | 1104 |
Files
| Filename | Size | md5 |
|---|---|---|
| ENCFF873QDA.bed.gz | 328.13 KB | 01bf7b998b43991fb59516b9727f96eb |
| ENCFF873QDA.tabix.bed.gz | 157.56 KB | 3663f544f695b3e6dc56685fb55c97b9 |
| ENCFF873QDA.tabix.bed.gz.tbi | 107.82 KB | 768b64d933d8eca1e559dd7ab536a38c |
| genomic_resource.yaml | 2.82 KB | 5f930f6bffc7fbbf5c6fb871996c88df |
| statistics/ |