Resource
| Id | Histone_ChIP-seq/ENCSR826MTK |
|---|---|
| Type | position_score |
| Version | 0 |
| Summary | Histone_ChIP-seq ENCSR826MTK [biosample_summary="Homo sapiens spleen tissue female adult (51 years)" and target="H3K27me3"] |
| Description |
status: released biological_replicates: Rep 1, Rep 2 summary: female adult (51 years) output_type: replicated peaks audit_internal_action: Archived analysis {ENCAN401MOG|/analyses/ENCAN401MOG/} has in progress subobject quality standard {encode3-histone-chip|/quality-standards/encode3-histone-chip/} audit_warning: PBC1 (PCR Bottlenecking Coefficient 1, M1/M_distinct) is the ratio of the number of genomic locations where exactly one read maps uniquely (M1) to the number of genomic locations where some reads map (M_distinct). A PBC1 value in the range 0 - 0.5 is severe bottlenecking, 0.5 - 0.8 is moderate bottlenecking, 0.8 - 0.9 is mild bottlenecking, and > 0.9 is no bottlenecking. PBC1 value > 0.9 is recommended, but > 0.8 is acceptable. ENCODE processed alignments file {ENCFF581DMY|/files/ENCFF581DMY/} processed by ChIP-seq ENCODE3 GRCh38 pipeline was generated from a library with PBC1 value of 0.89. audit_warning: PBC2 (PCR Bottlenecking Coefficient 2, M1/M2) is the ratio of the number of genomic locations where exactly one read maps uniquely (M1) to the number of genomic locations where two reads map uniquely (M2). A PBC2 value in the range 0 - 1 is severe bottlenecking, 1 - 3 is moderate bottlenecking, 3 - 10 is mild bottlenecking, > 10 is no bottlenecking. PBC2 value > 10 is recommended, but > 3 is acceptable. ENCODE processed alignments file {ENCFF581DMY|/files/ENCFF581DMY/} processed by ChIP-seq ENCODE3 GRCh38 pipeline was generated from a library with PBC2 value of 8.95. |
| Labels |
|
Scores (1)
| ID | Type | Default annotation | Description | Histogram | Range | Summary |
|---|---|---|---|---|---|---|
| Histone_ChIP-seq_ENCSR826MTK | float |
Histone_ChIP-seq_ENCSR826MTK |
Histone_ChIP-seq ENCSR826MTK [biosample_summary="Homo sapiens spleen tissue female adult (51 years)" and target="H3K27me3"]
|
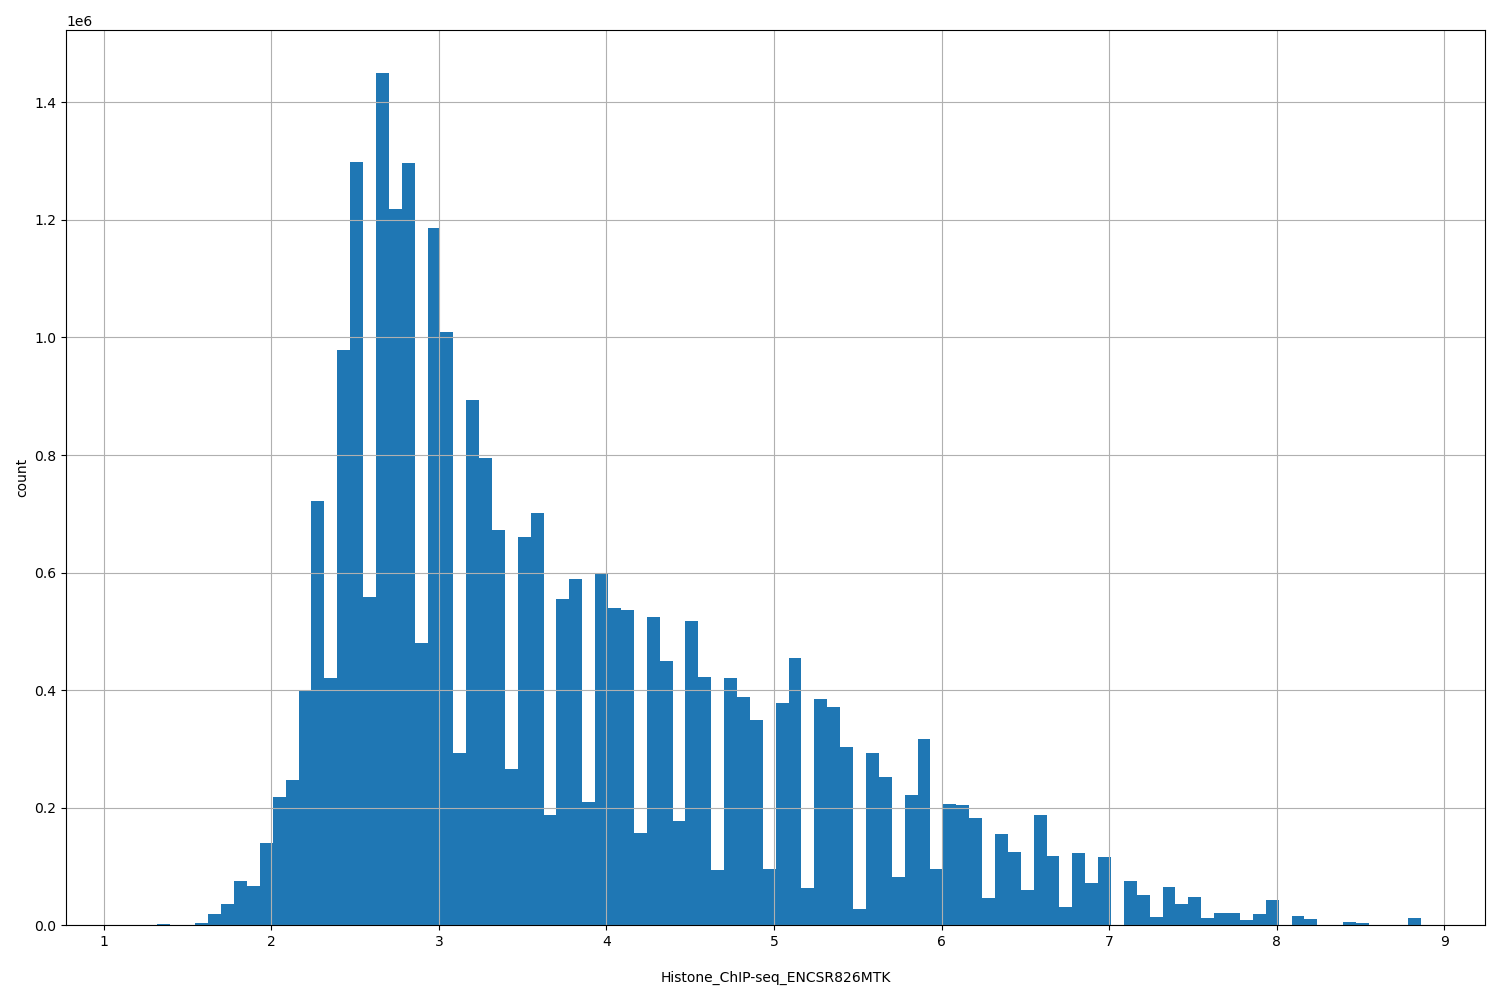 |
[1.16, 8.86] |
|
n counts base pairs; sd is the population standard deviation.
Coverage
| Chromosome | Covered positions | Covered % | Segments |
|---|---|---|---|
| all chromosomes | 28276056 | 0.88% | 25974 |
| chr1 | 2552924 | 1.03% | 2401 |
| chr1_KI270712v1_random | 3554 | 2.02% | 5 |
| chr1_KI270713v1_random | 3810 | 9.35% | 4 |
| chr1_KI270714v1_random | 322 | 0.77% | 1 |
| chr2 | 2092721 | 0.86% | 1728 |
| chr3 | 1094426 | 0.55% | 992 |
| chr4 | 1131073 | 0.59% | 909 |
| chr5 | 1540697 | 0.85% | 1352 |
| chr6 | 1940468 | 1.14% | 1610 |
| chr7 | 1354405 | 0.85% | 1046 |
| chr8 | 1164673 | 0.80% | 1018 |
| chr9 | 1118365 | 0.81% | 962 |
| chr10 | 1460725 | 1.09% | 1304 |
| chr11 | 1276759 | 0.95% | 1169 |
| chr12 | 1312015 | 0.98% | 1189 |
| chr13 | 703406 | 0.62% | 605 |
| chr14 | 832283 | 0.78% | 715 |
| chr15 | 932361 | 0.91% | 918 |
| chr16 | 819917 | 0.91% | 713 |
| chr17 | 1589762 | 1.91% | 1335 |
| chr17_GL000205v2_random | 16835 | 9.07% | 12 |
| chr18 | 470003 | 0.58% | 459 |
| chr19 | 1422820 | 2.43% | 1192 |
| chr20 | 995621 | 1.54% | 944 |
| chr21 | 263831 | 0.56% | 246 |
| chr22 | 522460 | 1.03% | 550 |
| chr22_KI270733v1_random | 8524 | 4.74% | 16 |
| chrUn_GL000219v1 | 11752 | 6.56% | 10 |
| chrUn_GL000224v1 | 1972 | 1.10% | 4 |
| chrUn_KI270467v1 | 1242 | 31.68% | 2 |
| chrUn_KI270744v1 | 1697 | 1.01% | 3 |
| chrX | 1634633 | 1.05% | 2560 |
| 3334 contigs with no values (185149349 bp) | 0 | 0.00% | 0 |
Segment lengths
| segments | min | max | mean | median | |
|---|---|---|---|---|---|
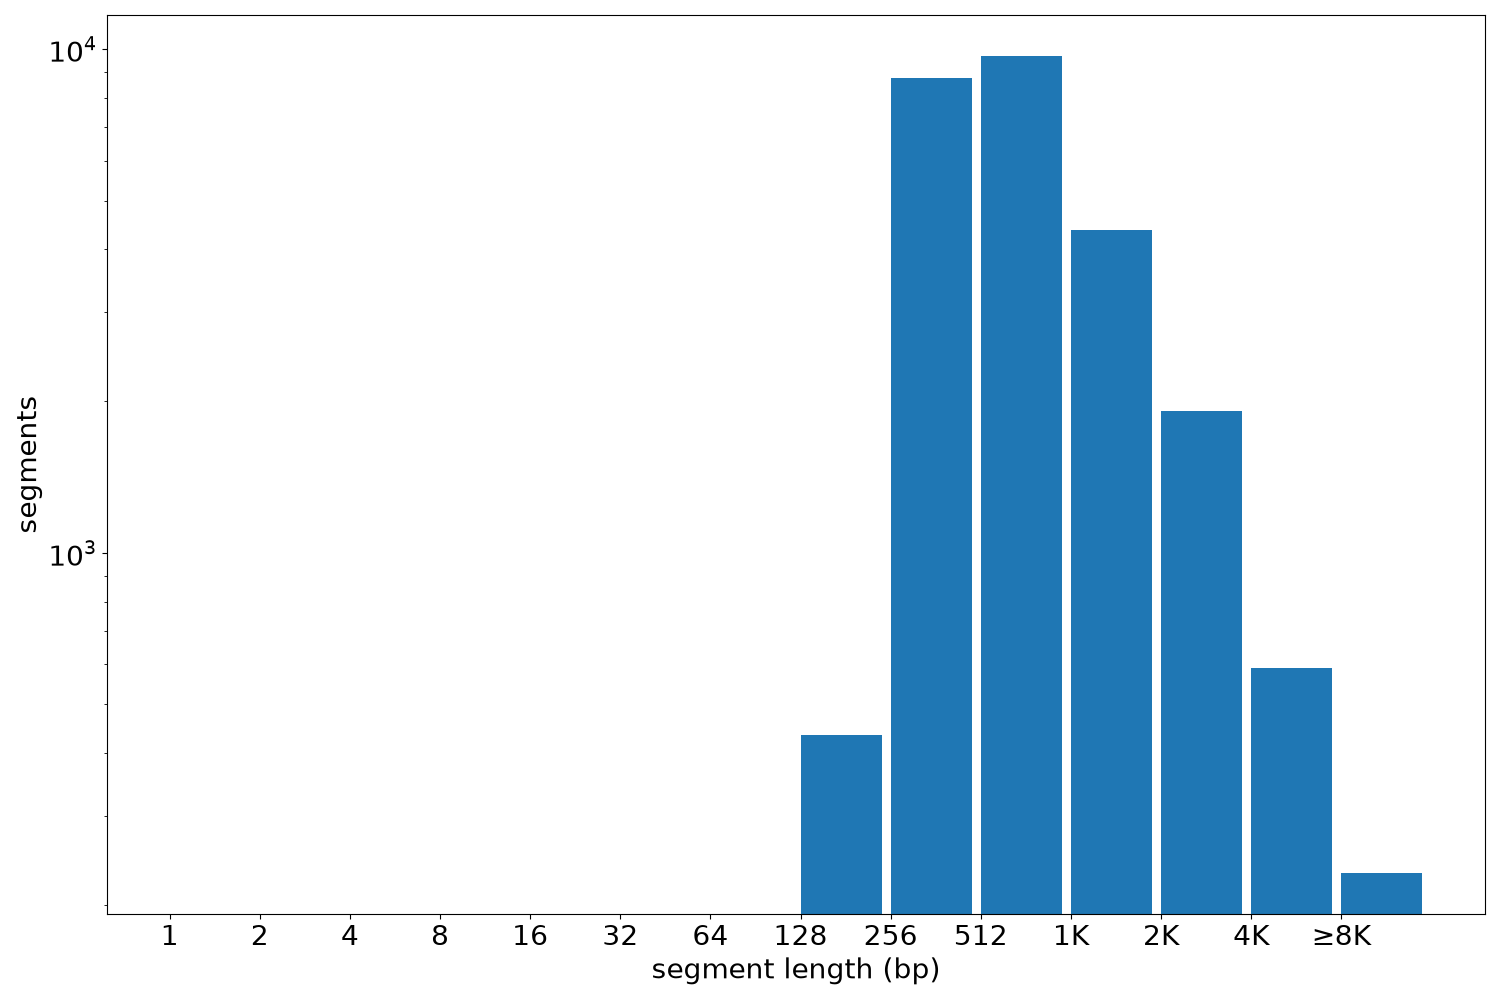
| segments | 25974 | 215 | 38152 | 1088.63 | 642 |
Files
| Filename | Size | md5 |
|---|---|---|
| ENCFF153IDC.bed.gz | 501.67 KB | 3ac0c5d18d1585f419cc20bc3f65f16c |
| ENCFF153IDC.tabix.bed.gz | 258.12 KB | d224b331dd12377fabb6183e7d829d44 |
| ENCFF153IDC.tabix.bed.gz.tbi | 112.0 KB | 529da8f53f53ddb64e35c61b18ef6fe0 |
| genomic_resource.yaml | 2.75 KB | 0f457b21d5ffb39474f314267937fe3d |
| statistics/ |