Resource
| Id | Histone_ChIP-seq/ENCSR814XPE |
|---|---|
| Type | position_score |
| Version | 0 |
| Summary | Histone_ChIP-seq ENCSR814XPE [biosample_summary="Homo sapiens H1" and target="H3K4me3"] |
| Description |
status: released biological_replicates: Rep 1, Rep 2 summary: output_type: replicated peaks audit_internal_action: Archived analysis {ENCAN665WYP|/analyses/ENCAN665WYP/} has in progress subobject quality standard {encode3-histone-chip|/quality-standards/encode3-histone-chip/} audit_warning: PBC1 (PCR Bottlenecking Coefficient 1, M1/M_distinct) is the ratio of the number of genomic locations where exactly one read maps uniquely (M1) to the number of genomic locations where some reads map (M_distinct). A PBC1 value in the range 0 - 0.5 is severe bottlenecking, 0.5 - 0.8 is moderate bottlenecking, 0.8 - 0.9 is mild bottlenecking, and > 0.9 is no bottlenecking. PBC1 value > 0.9 is recommended, but > 0.8 is acceptable. ENCODE processed alignments file {ENCFF539XVD|/files/ENCFF539XVD/} processed by ChIP-seq ENCODE3 hg19 pipeline was generated from a library with PBC1 value of 0.87. audit_warning: PBC2 (PCR Bottlenecking Coefficient 2, M1/M2) is the ratio of the number of genomic locations where exactly one read maps uniquely (M1) to the number of genomic locations where two reads map uniquely (M2). A PBC2 value in the range 0 - 1 is severe bottlenecking, 1 - 3 is moderate bottlenecking, 3 - 10 is mild bottlenecking, > 10 is no bottlenecking. PBC2 value > 10 is recommended, but > 3 is acceptable. ENCODE processed alignments file {ENCFF539XVD|/files/ENCFF539XVD/} processed by ChIP-seq ENCODE3 hg19 pipeline was generated from a library with PBC2 value of 8.82. |
| Labels |
|
Scores (1)
| ID | Type | Default annotation | Description | Histogram | Range | Summary |
|---|---|---|---|---|---|---|
| Histone_ChIP-seq_ENCSR814XPE | float |
Histone_ChIP-seq_ENCSR814XPE |
Histone_ChIP-seq ENCSR814XPE [biosample_summary="Homo sapiens H1" and target="H3K4me3"]
|
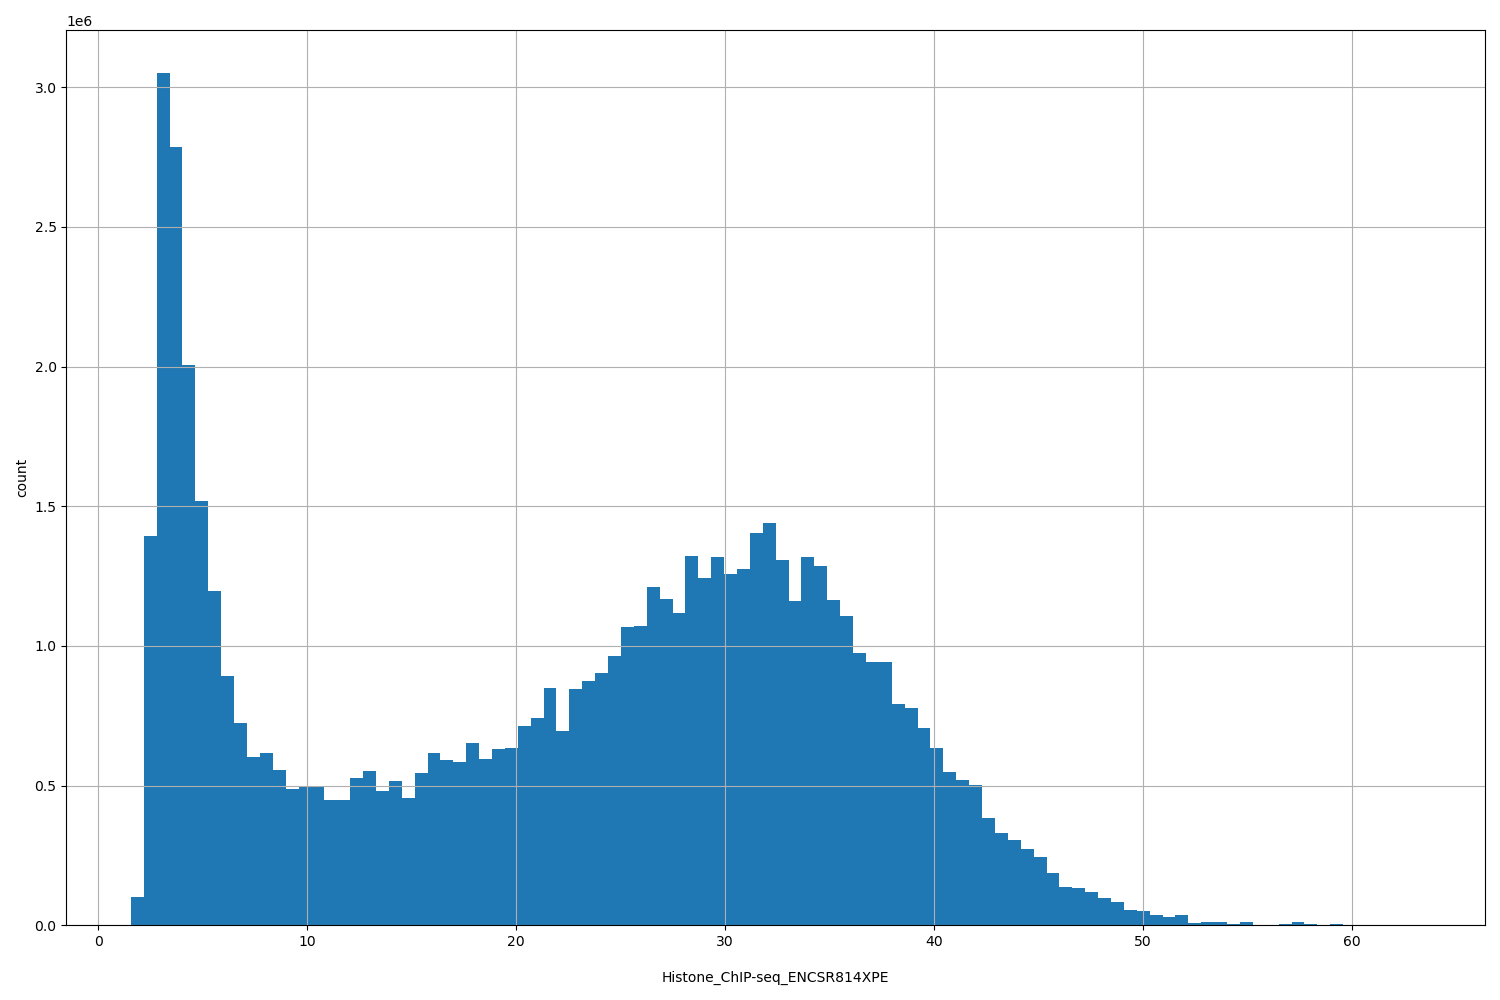 |
[1.56, 63.3] |
|
n counts base pairs; sd is the population standard deviation.
Coverage
| Chromosome | Covered positions | Covered % | Segments |
|---|---|---|---|
| all chromosomes | 63960995 | 1.99% | 42432 |
| chr1 | 6184792 | 2.48% | 3962 |
| chr2 | 4472389 | 1.85% | 3001 |
| chr3 | 3612384 | 1.82% | 2435 |
| chr4 | 2841564 | 1.49% | 1965 |
| chr5 | 3268928 | 1.80% | 2178 |
| chr6 | 3949371 | 2.31% | 2470 |
| chr7 | 3189428 | 2.00% | 2239 |
| chr8 | 2521847 | 1.74% | 1746 |
| chr9 | 2552434 | 1.84% | 1728 |
| chr10 | 2738359 | 2.05% | 1835 |
| chr11 | 3328778 | 2.46% | 2132 |
| chr12 | 3278059 | 2.46% | 2103 |
| chr13 | 1469369 | 1.28% | 985 |
| chr14 | 2092830 | 1.96% | 1349 |
| chr15 | 2052662 | 2.01% | 1363 |
| chr16 | 2294496 | 2.54% | 1559 |
| chr17 | 3319431 | 3.99% | 2082 |
| chr18 | 1218324 | 1.52% | 843 |
| chr19 | 3721488 | 6.35% | 2530 |
| chr20 | 1682365 | 2.61% | 1126 |
| chr21 | 650727 | 1.39% | 467 |
| chr22 | 1217779 | 2.40% | 851 |
| chrX | 2227666 | 1.43% | 1434 |
| chrY | 75525 | 0.13% | 49 |
| 3342 contigs with no values (129077085 bp) | 0 | 0.00% | 0 |
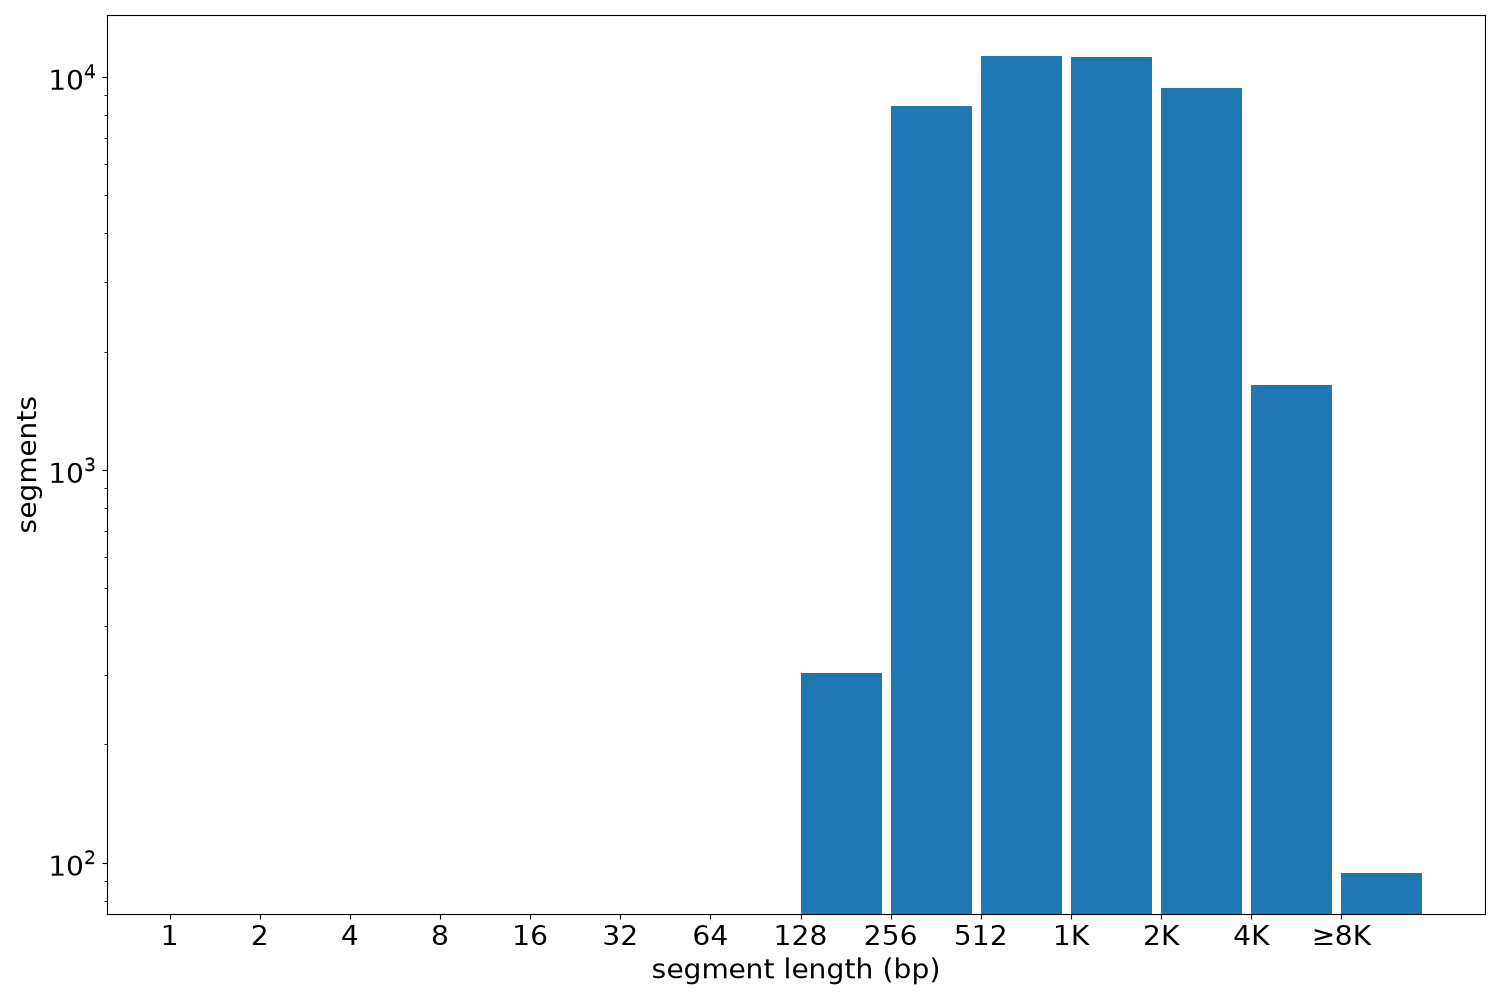
Segment lengths
| segments | min | max | mean | median | |
|---|---|---|---|---|---|
| segments | 42432 | 210 | 16013 | 1507.38 | 1099 |
Files
| Filename | Size | md5 |
|---|---|---|
| ENCFF192QQV.bed.gz | 1.18 MB | 387863ce50dae4120a70a9b4f1b535a8 |
| ENCFF192QQV.tabix.bed.gz | 495.98 KB | 86b4815d5313512ae0bd8ca20d75dca9 |
| ENCFF192QQV.tabix.bed.gz.tbi | 223.36 KB | cd9f9e445361cc5e058d06f77370cbd6 |
| genomic_resource.yaml | 2.65 KB | 0c2c2d7f78ea456ab30f95b171814ffe |
| statistics/ |