Resource
| Id | Histone_ChIP-seq/ENCSR780FXX |
|---|---|
| Type | position_score |
| Version | 0 |
| Summary | Histone_ChIP-seq ENCSR780FXX [biosample_summary="Homo sapiens brain tissue female embryo (17 weeks)" and target="H3K4me3"] |
| Description |
status: released biological_replicates: Rep 1, Rep 2 summary: female embryo (17 weeks) output_type: pseudoreplicated peaks audit_internal_action: Released analysis {ENCAN239CVM|/analyses/ENCAN239CVM/} has in progress subobject quality standard {encode4-histone-chip|/quality-standards/encode4-histone-chip/} audit_warning: PBC1 (PCR Bottlenecking Coefficient 1, M1/M_distinct) is the ratio of the number of genomic locations where exactly one read maps uniquely (M1) to the number of genomic locations where some reads map (M_distinct). A PBC1 value in the range 0 - 0.5 is severe bottlenecking, 0.5 - 0.8 is moderate bottlenecking, 0.8 - 0.9 is mild bottlenecking, and > 0.9 is no bottlenecking. PBC1 value > 0.9 is recommended, but > 0.8 is acceptable. ENCODE processed redacted alignments file {ENCFF885QLM|/files/ENCFF885QLM/} processed by ChIP-seq ENCODE4 v1.7.0 GRCh38 pipeline was generated from a library with PBC1 value of 0.83. audit_warning: PBC2 (PCR Bottlenecking Coefficient 2, M1/M2) is the ratio of the number of genomic locations where exactly one read maps uniquely (M1) to the number of genomic locations where two reads map uniquely (M2). A PBC2 value in the range 0 - 1 is severe bottlenecking, 1 - 3 is moderate bottlenecking, 3 - 10 is mild bottlenecking, > 10 is no bottlenecking. PBC2 value > 10 is recommended, but > 3 is acceptable. ENCODE processed redacted alignments file {ENCFF885QLM|/files/ENCFF885QLM/} processed by ChIP-seq ENCODE4 v1.7.0 GRCh38 pipeline was generated from a library with PBC2 value of 6.06. |
| Labels |
|
Scores (1)
| ID | Type | Default annotation | Description | Histogram | Range | Summary |
|---|---|---|---|---|---|---|
| Histone_ChIP-seq_ENCSR780FXX | float |
Histone_ChIP-seq_ENCSR780FXX |
Histone_ChIP-seq ENCSR780FXX [biosample_summary="Homo sapiens brain tissue female embryo (17 weeks)" and target="H3K4me3"]
|
 |
[1.8, 86.2] |
|
n counts base pairs; sd is the population standard deviation.
Coverage
| Chromosome | Covered positions | Covered % | Segments |
|---|---|---|---|
| all chromosomes | 52479185 | 1.63% | 31670 |
| chr1 | 5206270 | 2.09% | 3159 |
| chr2 | 3752236 | 1.55% | 2262 |
| chr3 | 2909845 | 1.47% | 1712 |
| chr4 | 2084409 | 1.10% | 1220 |
| chr5 | 2605194 | 1.44% | 1545 |
| chr6 | 2963289 | 1.73% | 1768 |
| chr7 | 2622119 | 1.65% | 1631 |
| chr8 | 2094726 | 1.44% | 1277 |
| chr9 | 2148326 | 1.55% | 1332 |
| chr10 | 2179245 | 1.63% | 1371 |
| chr11 | 2852588 | 2.11% | 1687 |
| chr12 | 2674982 | 2.01% | 1550 |
| chr13 | 1139265 | 1.00% | 685 |
| chr14 | 1757719 | 1.64% | 1040 |
| chr15 | 1711553 | 1.68% | 1076 |
| chr16 | 1946000 | 2.15% | 1231 |
| chr17 | 2879116 | 3.46% | 1694 |
| chr18 | 983377 | 1.22% | 617 |
| chr19 | 3200705 | 5.46% | 1879 |
| chr20 | 1371762 | 2.13% | 859 |
| chr21 | 461525 | 0.99% | 318 |
| chr22 | 1239772 | 2.44% | 753 |
| chrX | 1694918 | 1.09% | 1003 |
| chrY | 244 | <0.01% | 1 |
| 3342 contigs with no values (129077085 bp) | 0 | 0.00% | 0 |
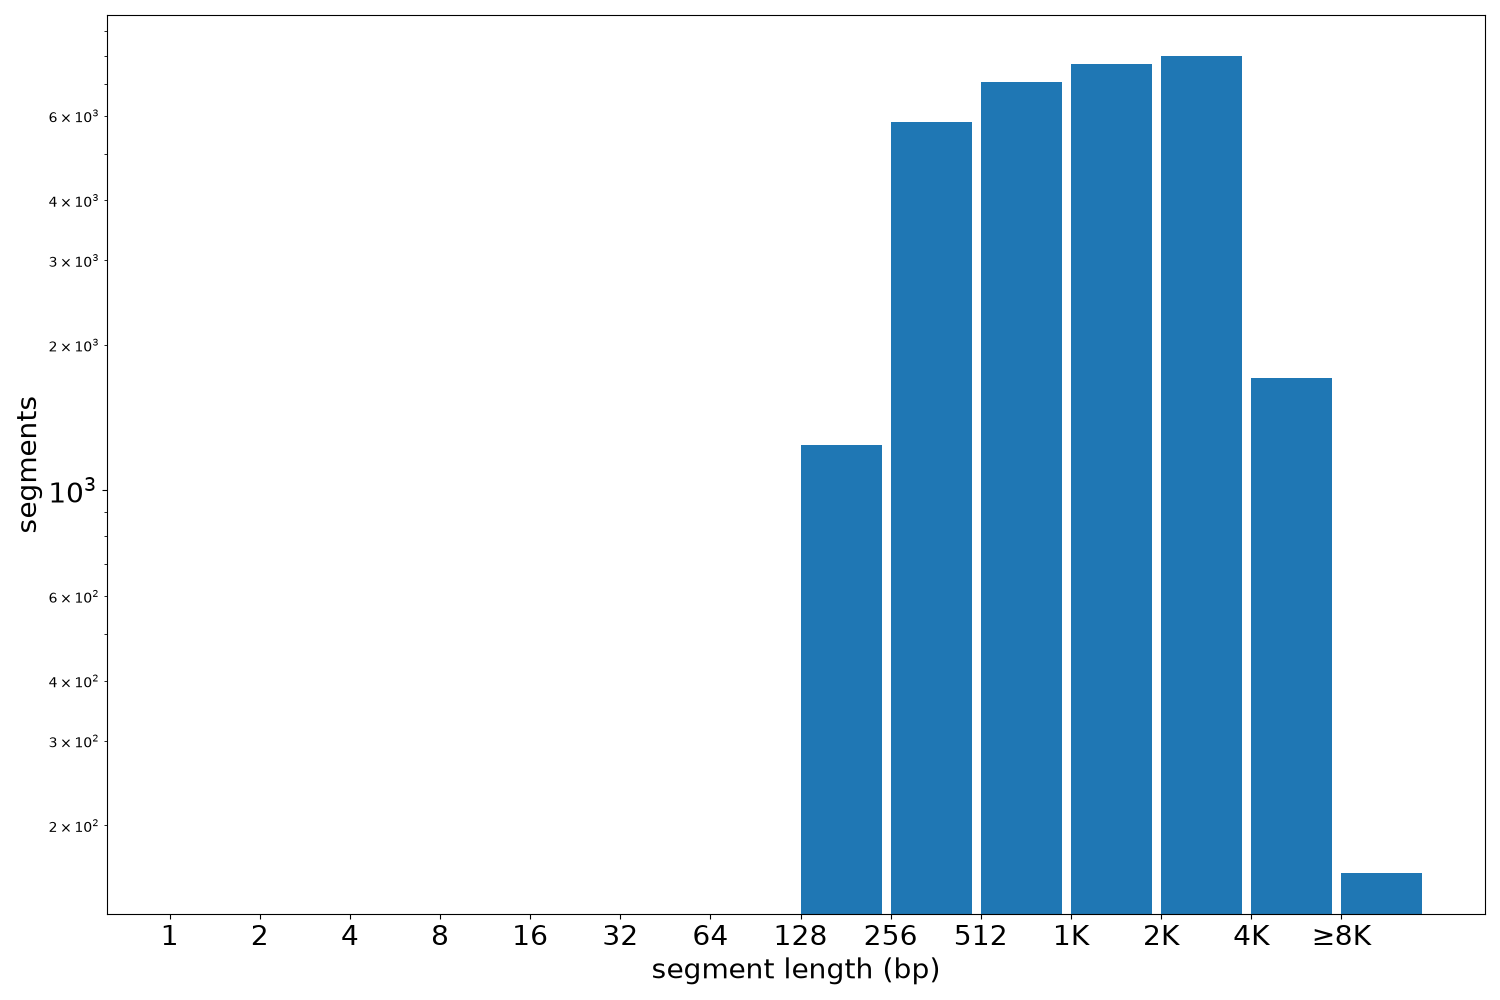
Segment lengths
| segments | min | max | mean | median | |
|---|---|---|---|---|---|
| segments | 31670 | 208 | 41840 | 1657.06 | 1219 |
Files
| Filename | Size | md5 |
|---|---|---|
| ENCFF590UXV.bed.gz | 737.15 KB | b7997d923f952e6f83a3b3d0d43f3292 |
| ENCFF590UXV.tabix.bed.gz | 347.64 KB | 9252c3dd9b93155680896382668f5177 |
| ENCFF590UXV.tabix.bed.gz.tbi | 184.22 KB | 502f0019a5651f7f542d28ba94290ea6 |
| genomic_resource.yaml | 2.79 KB | 58719cde7ad1cfb7271fc8c040324f22 |
| statistics/ |