Resource
| Id | Histone_ChIP-seq/ENCSR758OEC |
|---|---|
| Type | position_score |
| Version | 0 |
| Summary | Histone_ChIP-seq ENCSR758OEC [biosample_summary="Homo sapiens MM.1S" and target="H3K27ac"] |
| Description |
status: released biological_replicates: Rep 1, Rep 2 summary: output_type: replicated peaks audit_internal_action: Archived analysis {ENCAN773BPG|/analyses/ENCAN773BPG/} has in progress subobject quality standard {encode3-histone-chip|/quality-standards/encode3-histone-chip/} audit_warning: PBC1 (PCR Bottlenecking Coefficient 1, M1/M_distinct) is the ratio of the number of genomic locations where exactly one read maps uniquely (M1) to the number of genomic locations where some reads map (M_distinct). A PBC1 value in the range 0 - 0.5 is severe bottlenecking, 0.5 - 0.8 is moderate bottlenecking, 0.8 - 0.9 is mild bottlenecking, and > 0.9 is no bottlenecking. PBC1 value > 0.9 is recommended, but > 0.8 is acceptable. ENCODE processed alignments file {ENCFF014EKJ|/files/ENCFF014EKJ/} processed by ChIP-seq ENCODE3 hg19 pipeline was generated from a library with PBC1 value of 0.88. |
| Labels |
|
Scores (1)
| ID | Type | Default annotation | Description | Histogram | Range | Summary |
|---|---|---|---|---|---|---|
| Histone_ChIP-seq_ENCSR758OEC | float |
Histone_ChIP-seq_ENCSR758OEC |
Histone_ChIP-seq ENCSR758OEC [biosample_summary="Homo sapiens MM.1S" and target="H3K27ac"]
|
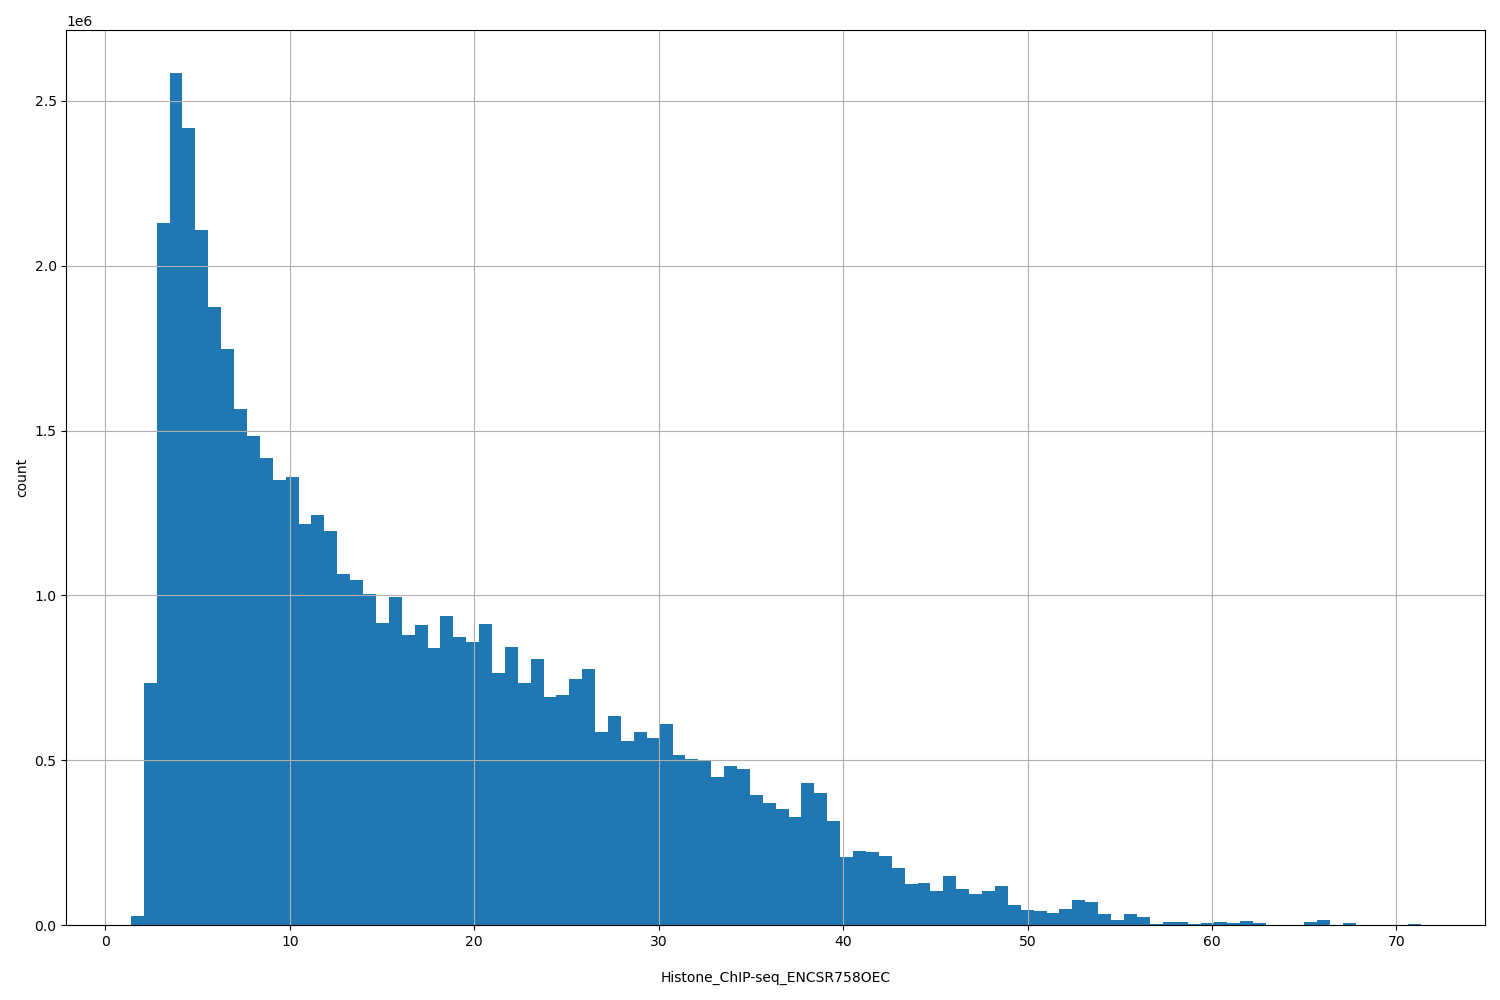 |
[1.38, 71.3] |
|
n counts base pairs; sd is the population standard deviation.
Coverage
| Chromosome | Covered positions | Covered % | Segments |
|---|---|---|---|
| all chromosomes | 53412011 | 1.66% | 40732 |
| chr1 | 4871711 | 1.96% | 3749 |
| chr2 | 4518286 | 1.87% | 3321 |
| chr3 | 3604102 | 1.82% | 2748 |
| chr4 | 2618159 | 1.38% | 2053 |
| chr5 | 3100929 | 1.71% | 2243 |
| chr6 | 3451683 | 2.02% | 2518 |
| chr7 | 2621969 | 1.65% | 2084 |
| chr8 | 2314981 | 1.60% | 1805 |
| chr9 | 1954763 | 1.41% | 1566 |
| chr10 | 2367604 | 1.77% | 1806 |
| chr11 | 2712908 | 2.01% | 2059 |
| chr12 | 2812353 | 2.11% | 2108 |
| chr13 | 1068433 | 0.93% | 909 |
| chr14 | 1489219 | 1.39% | 1152 |
| chr15 | 1933488 | 1.90% | 1445 |
| chr16 | 1650982 | 1.83% | 1269 |
| chr17 | 2458054 | 2.95% | 1803 |
| chr18 | 1101323 | 1.37% | 845 |
| chr19 | 1575928 | 2.69% | 1329 |
| chr20 | 1602079 | 2.49% | 1143 |
| chr21 | 617102 | 1.32% | 478 |
| chr22 | 1197417 | 2.36% | 853 |
| chrX | 1768538 | 1.13% | 1446 |
| 3343 contigs with no values (186304500 bp) | 0 | 0.00% | 0 |
Segment lengths
| segments | min | max | mean | median | |
|---|---|---|---|---|---|
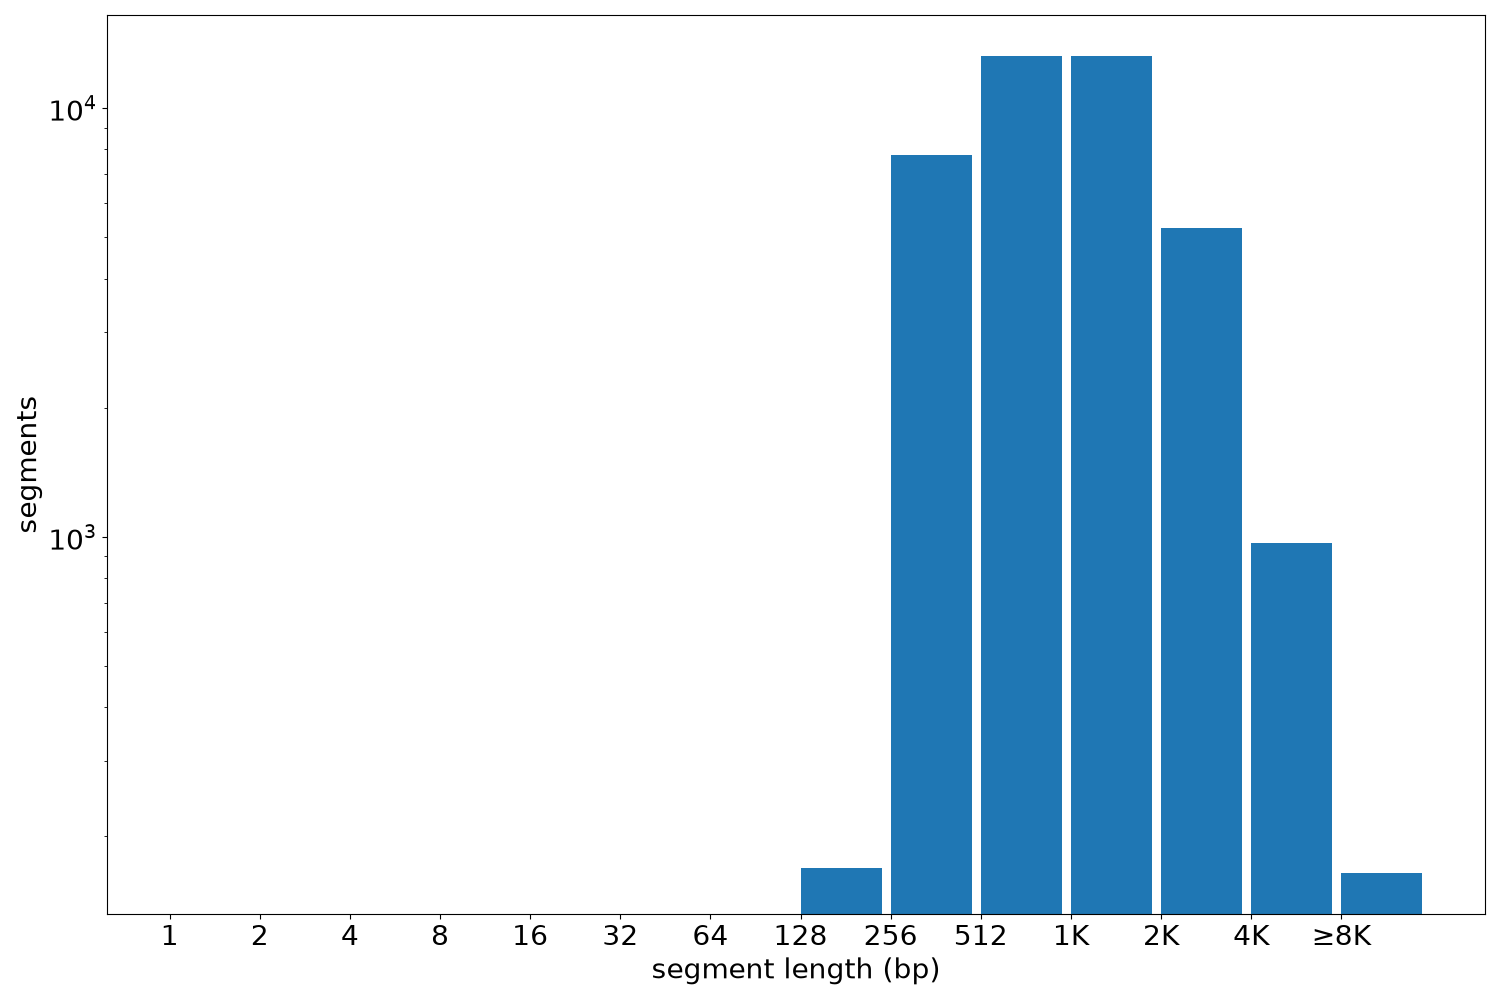
| segments | 40732 | 216 | 33811 | 1311.3 | 985 |
Files
| Filename | Size | md5 |
|---|---|---|
| ENCFF428WVA.bed.gz | 1.11 MB | d3df58ebb0f2f23670e3cb958dbb3ec3 |
| ENCFF428WVA.tabix.bed.gz | 470.77 KB | 132e247f47724bf0b61d2877f5365928 |
| ENCFF428WVA.tabix.bed.gz.tbi | 208.37 KB | ee67ad35c5a6e031a84da7ed8831b888 |
| genomic_resource.yaml | 2.03 KB | b6bb394bb099925af2eafa428f494ee3 |
| statistics/ |