Resource
| Id | Histone_ChIP-seq/ENCSR753HPM |
|---|---|
| Type | position_score |
| Version | 0 |
| Summary | Histone_ChIP-seq ENCSR753HPM [biosample_summary="Homo sapiens tibial artery tissue male adult (54 years)" and target="H3K36me3"] |
| Description |
status: released biological_replicates: Rep 1 summary: male adult (54 years) output_type: pseudoreplicated peaks audit_internal_action: Archived analysis {ENCAN843RGX|/analyses/ENCAN843RGX/} has in progress subobject quality standard {encode3-histone-chip|/quality-standards/encode3-histone-chip/} audit_warning: PBC1 (PCR Bottlenecking Coefficient 1, M1/M_distinct) is the ratio of the number of genomic locations where exactly one read maps uniquely (M1) to the number of genomic locations where some reads map (M_distinct). A PBC1 value in the range 0 - 0.5 is severe bottlenecking, 0.5 - 0.8 is moderate bottlenecking, 0.8 - 0.9 is mild bottlenecking, and > 0.9 is no bottlenecking. PBC1 value > 0.9 is recommended, but > 0.8 is acceptable. ENCODE processed alignments file {ENCFF766JNG|/files/ENCFF766JNG/} processed by ChIP-seq ENCODE3 GRCh38 pipeline was generated from a library with PBC1 value of 0.90. audit_warning: PBC2 (PCR Bottlenecking Coefficient 2, M1/M2) is the ratio of the number of genomic locations where exactly one read maps uniquely (M1) to the number of genomic locations where two reads map uniquely (M2). A PBC2 value in the range 0 - 1 is severe bottlenecking, 1 - 3 is moderate bottlenecking, 3 - 10 is mild bottlenecking, > 10 is no bottlenecking. PBC2 value > 10 is recommended, but > 3 is acceptable. ENCODE processed alignments file {ENCFF766JNG|/files/ENCFF766JNG/} processed by ChIP-seq ENCODE3 GRCh38 pipeline was generated from a library with PBC2 value of 9.71. |
| Labels |
|
Scores (1)
| ID | Type | Default annotation | Description | Histogram | Range | Summary |
|---|---|---|---|---|---|---|
| Histone_ChIP-seq_ENCSR753HPM | float |
Histone_ChIP-seq_ENCSR753HPM |
Histone_ChIP-seq ENCSR753HPM [biosample_summary="Homo sapiens tibial artery tissue male adult (54 years)" and target="H3K36me3"]
|
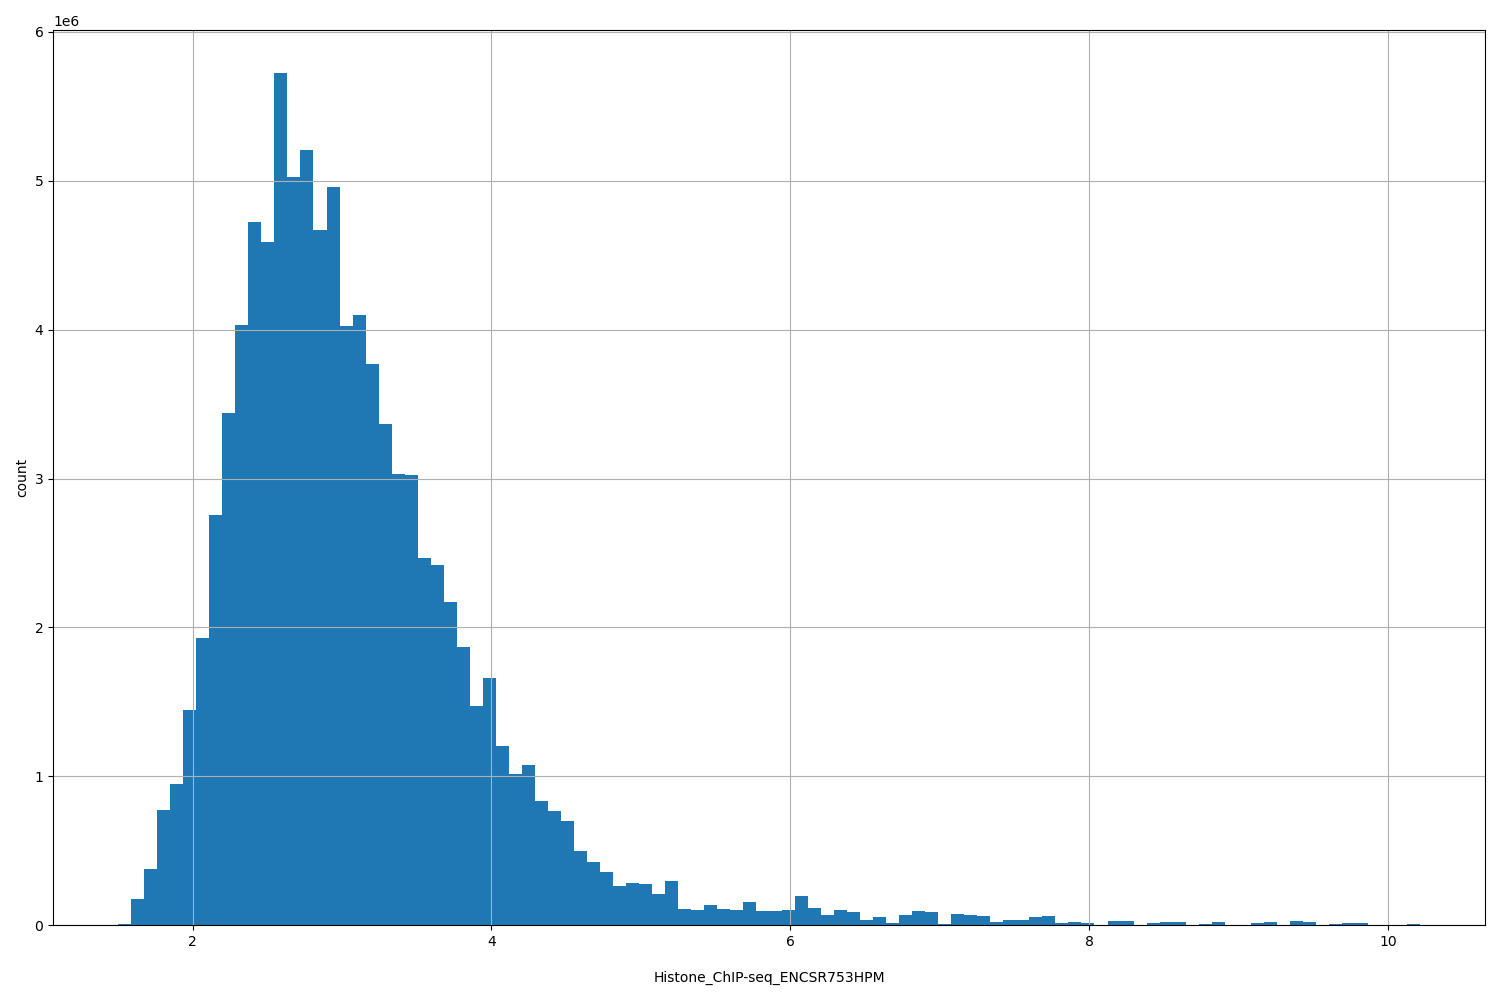 |
[1.5, 10.2] |
|
n counts base pairs; sd is the population standard deviation.
Coverage
| Chromosome | Covered positions | Covered % | Segments |
|---|---|---|---|
| all chromosomes | 95130061 | 2.96% | 68757 |
| chr1 | 9315584 | 3.74% | 6636 |
| chr1_KI270711v1_random | 1194 | 2.83% | 1 |
| chr2 | 7873198 | 3.25% | 5992 |
| chr3 | 6173259 | 3.11% | 4760 |
| chr4 | 4367327 | 2.30% | 3418 |
| chr5 | 4948131 | 2.73% | 3723 |
| chr6 | 4563998 | 2.67% | 3582 |
| chr7 | 4155339 | 2.61% | 3173 |
| chr8 | 3338132 | 2.30% | 2600 |
| chr9 | 4246825 | 3.07% | 3095 |
| chr10 | 4240667 | 3.17% | 3193 |
| chr11 | 4825496 | 3.57% | 3377 |
| chr12 | 5442824 | 4.08% | 3768 |
| chr13 | 2151721 | 1.88% | 1719 |
| chr14 | 3396554 | 3.17% | 2501 |
| chr15 | 3725431 | 3.65% | 2795 |
| chr16 | 3695893 | 4.09% | 2412 |
| chr17 | 4660465 | 5.60% | 3177 |
| chr18 | 1680312 | 2.09% | 1323 |
| chr19 | 6375887 | 10.88% | 3164 |
| chr20 | 2502603 | 3.88% | 1811 |
| chr21 | 992606 | 2.13% | 734 |
| chr22 | 1904897 | 3.75% | 1238 |
| chrUn_KI270442v1 | 373 | 0.10% | 1 |
| chrX | 521962 | 0.33% | 533 |
| chrY | 29383 | 0.05% | 31 |
| 3340 contigs with no values (128642814 bp) | 0 | 0.00% | 0 |
Segment lengths
| segments | min | max | mean | median | |
|---|---|---|---|---|---|
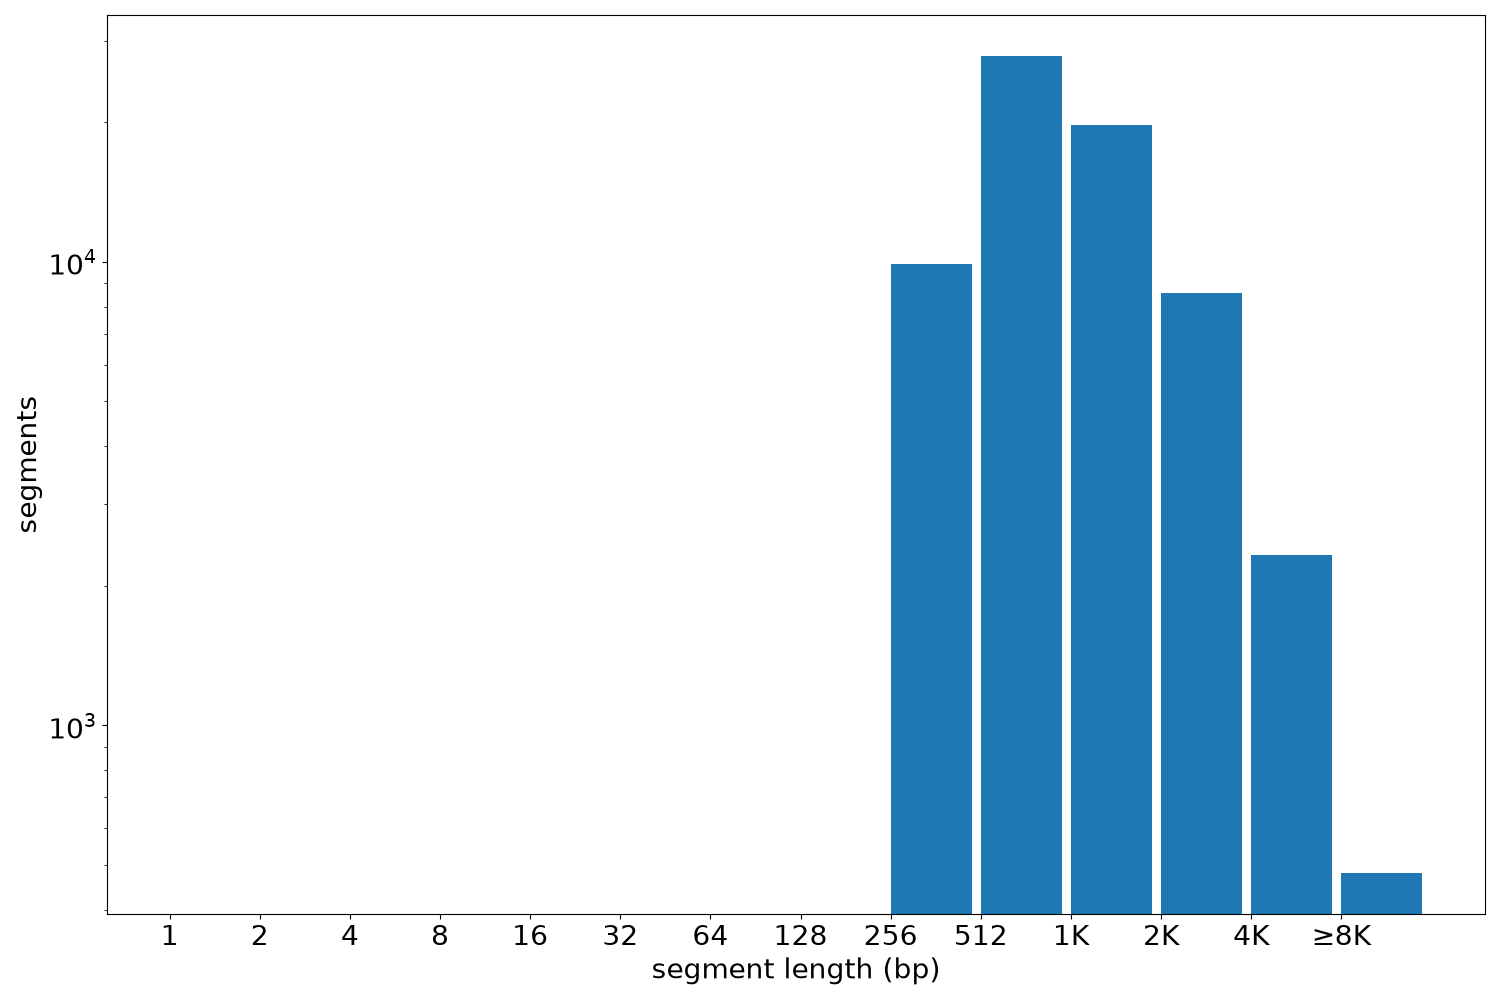
| segments | 68757 | 370 | 51788 | 1383.57 | 940 |
Files
| Filename | Size | md5 |
|---|---|---|
| ENCFF120LRR.bed.gz | 1.51 MB | adfcb0773b0784f9c7e44e8ec062b7d6 |
| ENCFF120LRR.tabix.bed.gz | 742.3 KB | ac21e02c5a1f6a9ae6489f88c7d35b42 |
| ENCFF120LRR.tabix.bed.gz.tbi | 148.84 KB | c0f4b123027acb307a7d7d1ba8169efc |
| genomic_resource.yaml | 2.76 KB | 0c8116de7d7e6600ad507338a43b3ff2 |
| statistics/ |