Resource
| Id | Histone_ChIP-seq/ENCSR728FLA |
|---|---|
| Type | position_score |
| Version | 0 |
| Summary | Histone_ChIP-seq ENCSR728FLA [biosample_summary="Homo sapiens lung tissue female adult (30 years)" and target="H3K9me3"] |
| Description |
status: released biological_replicates: Rep 1 summary: female adult (30 years) output_type: pseudoreplicated peaks audit_internal_action: Archived analysis {ENCAN854GZO|/analyses/ENCAN854GZO/} has in progress subobject quality standard {encode3-histone-chip|/quality-standards/encode3-histone-chip/} audit_warning: PBC1 (PCR Bottlenecking Coefficient 1, M1/M_distinct) is the ratio of the number of genomic locations where exactly one read maps uniquely (M1) to the number of genomic locations where some reads map (M_distinct). A PBC1 value in the range 0 - 0.5 is severe bottlenecking, 0.5 - 0.8 is moderate bottlenecking, 0.8 - 0.9 is mild bottlenecking, and > 0.9 is no bottlenecking. PBC1 value > 0.9 is recommended, but > 0.8 is acceptable. ENCODE processed alignments file {ENCFF611DHC|/files/ENCFF611DHC/} processed by ChIP-seq ENCODE3 hg19 pipeline was generated from a library with PBC1 value of 0.82. audit_warning: PBC2 (PCR Bottlenecking Coefficient 2, M1/M2) is the ratio of the number of genomic locations where exactly one read maps uniquely (M1) to the number of genomic locations where two reads map uniquely (M2). A PBC2 value in the range 0 - 1 is severe bottlenecking, 1 - 3 is moderate bottlenecking, 3 - 10 is mild bottlenecking, > 10 is no bottlenecking. PBC2 value > 10 is recommended, but > 3 is acceptable. ENCODE processed alignments file {ENCFF611DHC|/files/ENCFF611DHC/} processed by ChIP-seq ENCODE3 hg19 pipeline was generated from a library with PBC2 value of 6.25. |
| Labels |
|
Scores (1)
| ID | Type | Default annotation | Description | Histogram | Range | Summary |
|---|---|---|---|---|---|---|
| Histone_ChIP-seq_ENCSR728FLA | float |
Histone_ChIP-seq_ENCSR728FLA |
Histone_ChIP-seq ENCSR728FLA [biosample_summary="Homo sapiens lung tissue female adult (30 years)" and target="H3K9me3"]
|
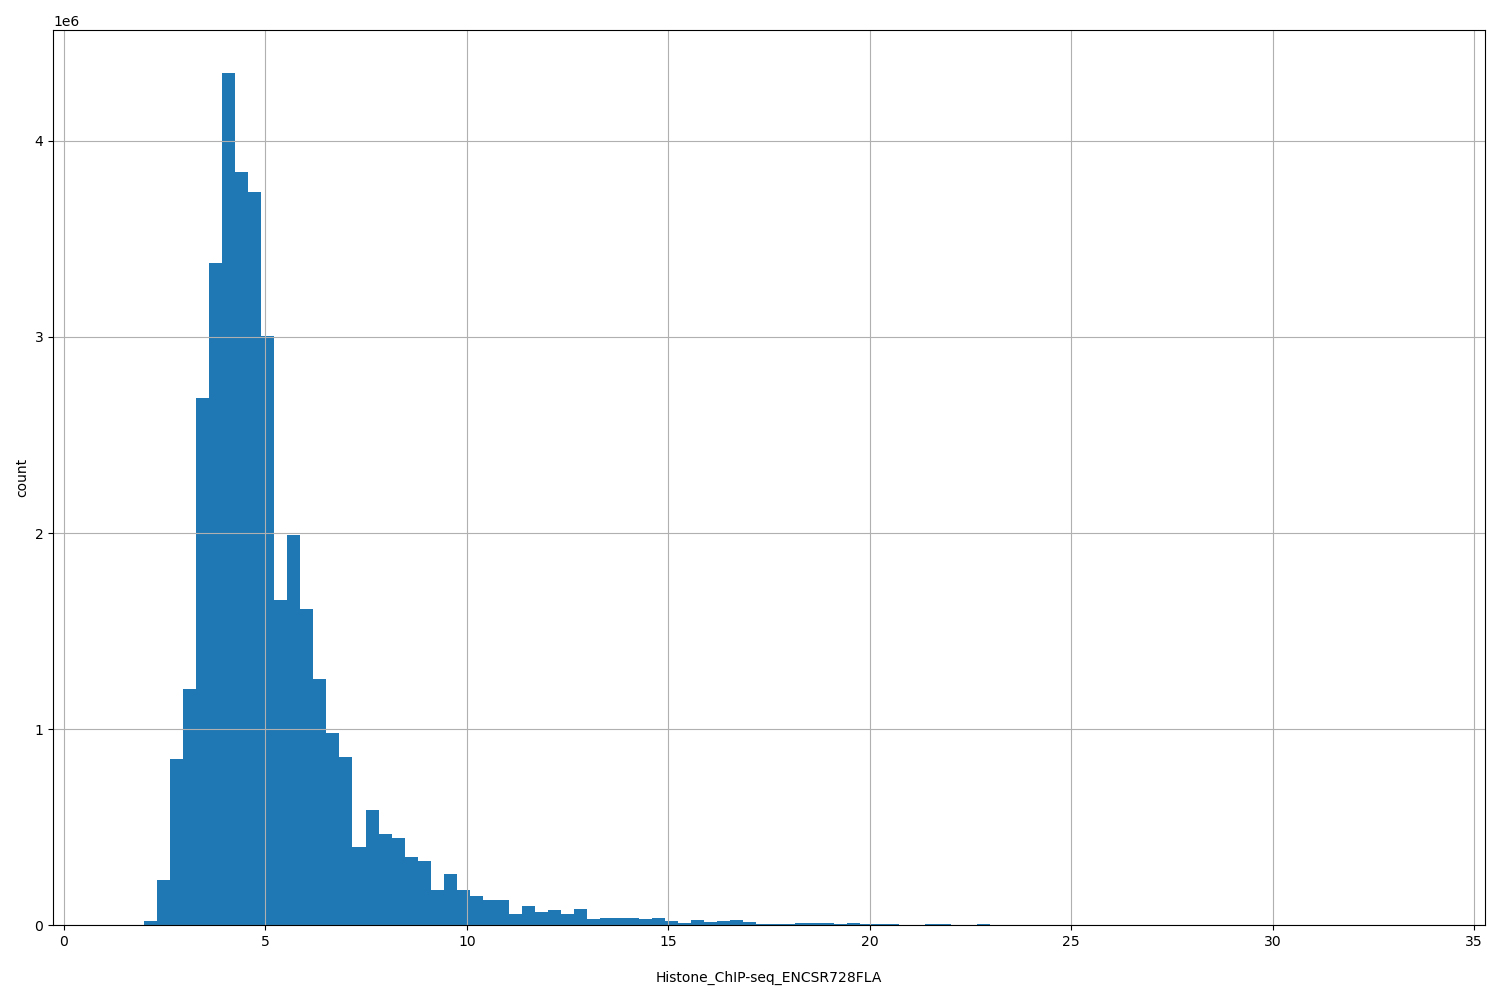 |
[1.35, 33.7] |
|
n counts base pairs; sd is the population standard deviation.
Coverage
| Chromosome | Covered positions | Covered % | Segments |
|---|---|---|---|
| all chromosomes | 36249482 | 1.13% | 149470 |
| chr1 | 2490281 | 1.00% | 10639 |
| chr2 | 2505534 | 1.03% | 10758 |
| chr3 | 1643603 | 0.83% | 6946 |
| chr4 | 1873566 | 0.98% | 7458 |
| chr5 | 2149515 | 1.18% | 8654 |
| chr6 | 1543605 | 0.90% | 6640 |
| chr7 | 2131477 | 1.34% | 8507 |
| chr8 | 1729321 | 1.19% | 7205 |
| chr9 | 1299890 | 0.94% | 5461 |
| chr10 | 1814549 | 1.36% | 7814 |
| chr11 | 1457103 | 1.08% | 6287 |
| chr12 | 1667364 | 1.25% | 6645 |
| chr13 | 960530 | 0.84% | 4038 |
| chr14 | 1047649 | 0.98% | 4453 |
| chr15 | 1037946 | 1.02% | 4211 |
| chr16 | 1389221 | 1.54% | 5805 |
| chr17 | 975659 | 1.17% | 4352 |
| chr18 | 860593 | 1.07% | 3743 |
| chr19 | 2809223 | 4.79% | 9741 |
| chr20 | 1183897 | 1.84% | 5106 |
| chr21 | 553259 | 1.18% | 2292 |
| chr22 | 688372 | 1.35% | 3035 |
| chrX | 2408633 | 1.54% | 9585 |
| chrY | 28692 | 0.05% | 95 |
| 3342 contigs with no values (129077085 bp) | 0 | 0.00% | 0 |
Segment lengths
| segments | min | max | mean | median | |
|---|---|---|---|---|---|
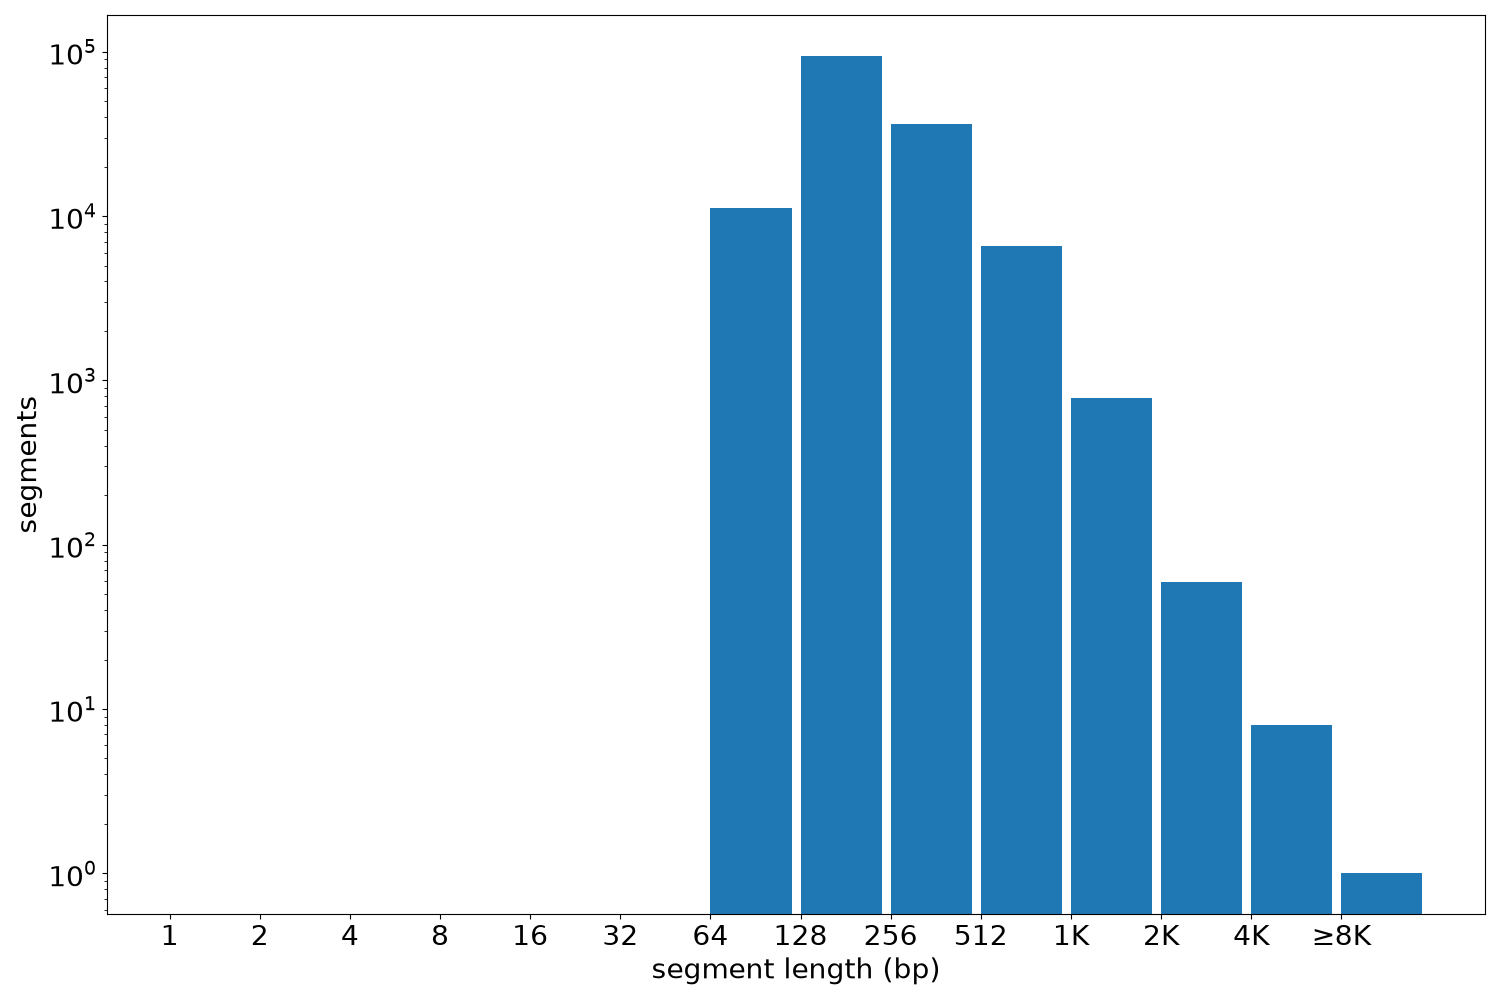
| segments | 149470 | 125 | 23273 | 242.52 | 196 |
Files
| Filename | Size | md5 |
|---|---|---|
| ENCFF533QEX.bed.gz | 2.52 MB | 3b4ad03d002018dab159fe266e5b5a22 |
| ENCFF533QEX.tabix.bed.gz | 1.33 MB | 769b3e9f2bd8706c059ccff68c3de400 |
| ENCFF533QEX.tabix.bed.gz.tbi | 509.25 KB | e427a5c00e9a51ef7acf4902acf5279f |
| genomic_resource.yaml | 2.74 KB | d2b9943194fdce78347742cf1f7f259a |
| statistics/ |