Resource
| Id | Histone_ChIP-seq/ENCSR714SGY |
|---|---|
| Type | position_score |
| Version | 0 |
| Summary | Histone_ChIP-seq ENCSR714SGY [biosample_summary="Homo sapiens muscle of trunk tissue female embryo (115 days)" and target="H3K4me3"] |
| Description |
status: released biological_replicates: Rep 1 summary: female embryo (115 days) output_type: pseudoreplicated peaks audit_internal_action: Archived analysis {ENCAN921MVU|/analyses/ENCAN921MVU/} has in progress subobject quality standard {encode3-histone-chip|/quality-standards/encode3-histone-chip/} audit_warning: PBC1 (PCR Bottlenecking Coefficient 1, M1/M_distinct) is the ratio of the number of genomic locations where exactly one read maps uniquely (M1) to the number of genomic locations where some reads map (M_distinct). A PBC1 value in the range 0 - 0.5 is severe bottlenecking, 0.5 - 0.8 is moderate bottlenecking, 0.8 - 0.9 is mild bottlenecking, and > 0.9 is no bottlenecking. PBC1 value > 0.9 is recommended, but > 0.8 is acceptable. ENCODE processed alignments file {ENCFF240PMO|/files/ENCFF240PMO/} processed by ChIP-seq ENCODE3 hg19 pipeline was generated from a library with PBC1 value of 0.88. |
| Labels |
|
Scores (1)
| ID | Type | Default annotation | Description | Histogram | Range | Summary |
|---|---|---|---|---|---|---|
| Histone_ChIP-seq_ENCSR714SGY | float |
Histone_ChIP-seq_ENCSR714SGY |
Histone_ChIP-seq ENCSR714SGY [biosample_summary="Homo sapiens muscle of trunk tissue female embryo (115 days)" and target="H3K4me3"]
|
 |
[1.67, 93.7] |
|
n counts base pairs; sd is the population standard deviation.
Coverage
| Chromosome | Covered positions | Covered % | Segments |
|---|---|---|---|
| all chromosomes | 33293955 | 1.03% | 29869 |
| chr1 | 3273674 | 1.31% | 2874 |
| chr2 | 2274711 | 0.94% | 2070 |
| chr3 | 1884817 | 0.95% | 1587 |
| chr4 | 1345042 | 0.71% | 1167 |
| chr5 | 1565993 | 0.86% | 1307 |
| chr6 | 1963889 | 1.15% | 1659 |
| chr7 | 1610069 | 1.01% | 1472 |
| chr8 | 1233548 | 0.85% | 1153 |
| chr9 | 1358548 | 0.98% | 1288 |
| chr10 | 1417923 | 1.06% | 1322 |
| chr11 | 1874427 | 1.39% | 1597 |
| chr12 | 1785953 | 1.34% | 1505 |
| chr13 | 686763 | 0.60% | 620 |
| chr14 | 1089243 | 1.02% | 944 |
| chr15 | 1063065 | 1.04% | 983 |
| chr16 | 1256911 | 1.39% | 1193 |
| chr17 | 1943901 | 2.33% | 1825 |
| chr18 | 570497 | 0.71% | 553 |
| chr19 | 2128559 | 3.63% | 1908 |
| chr20 | 866431 | 1.34% | 801 |
| chr21 | 309838 | 0.66% | 323 |
| chr22 | 686641 | 1.35% | 668 |
| chrX | 1103253 | 0.71% | 1049 |
| chrY | 259 | <0.01% | 1 |
| 3342 contigs with no values (129077085 bp) | 0 | 0.00% | 0 |
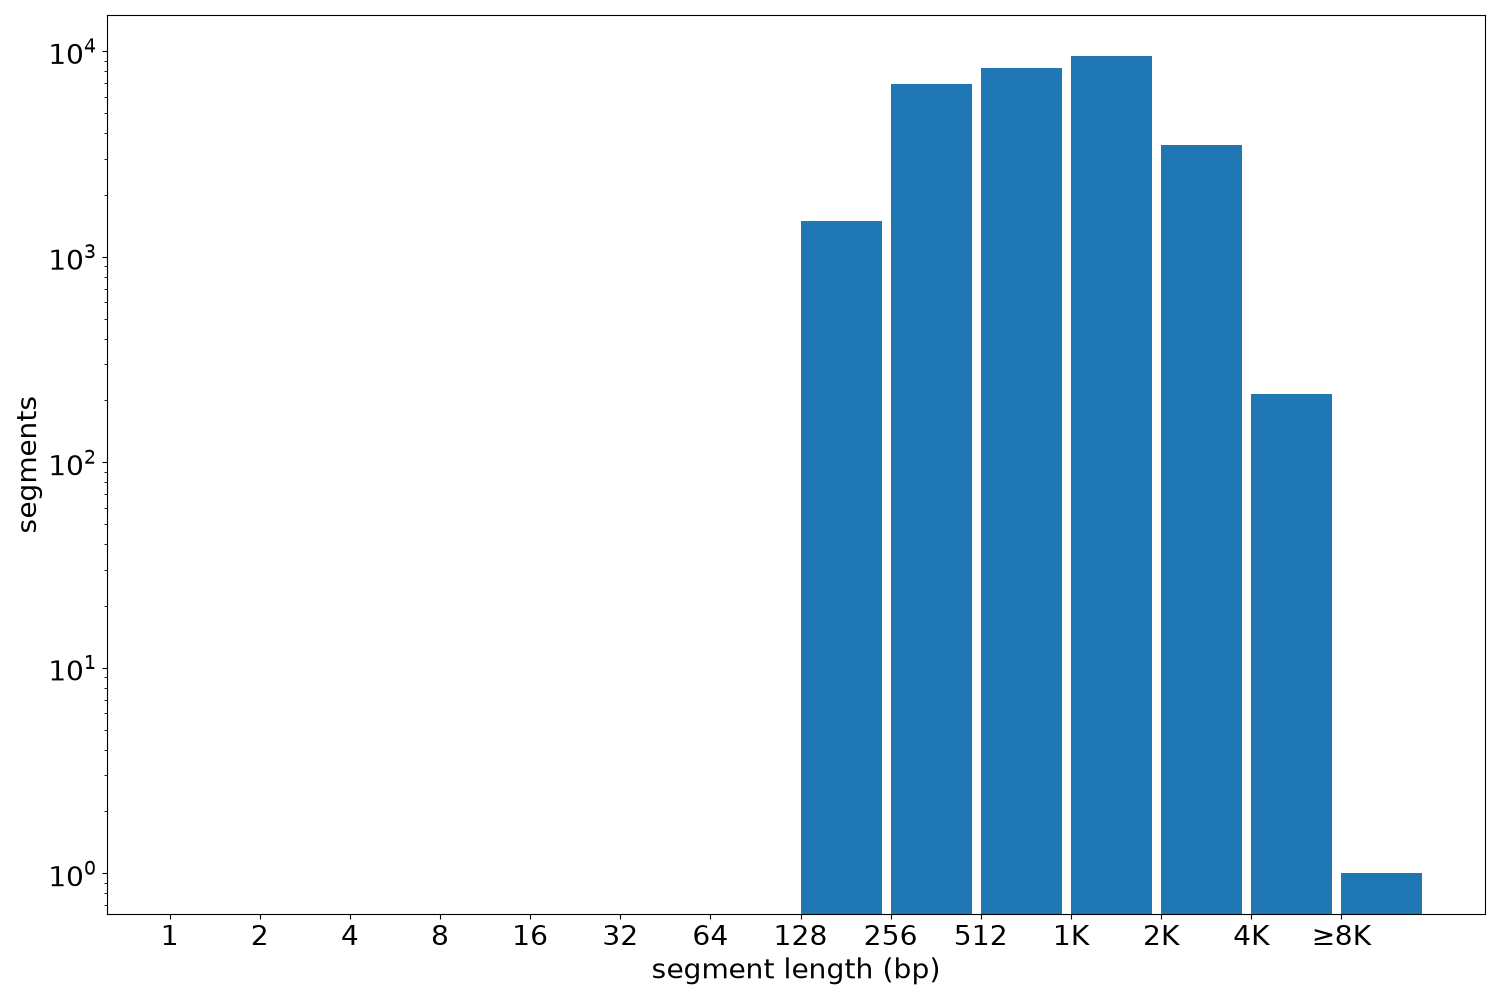
Segment lengths
| segments | min | max | mean | median | |
|---|---|---|---|---|---|
| segments | 29869 | 190 | 8376 | 1114.67 | 887 |
Files
| Filename | Size | md5 |
|---|---|---|
| ENCFF409AMD.bed.gz | 822.51 KB | 45ad589c466428e0040e2a8ee67e7fb5 |
| ENCFF409AMD.tabix.bed.gz | 346.25 KB | 092cba0fcc6ac880b820bdb143ad5139 |
| ENCFF409AMD.tabix.bed.gz.tbi | 157.5 KB | ae3b548047503df0aea20dd659528a58 |
| genomic_resource.yaml | 2.16 KB | 1b2634d575451cbd7b06c98c1dcaab0d |
| statistics/ |