Resource
| Id | Histone_ChIP-seq/ENCSR694LBI |
|---|---|
| Type | position_score |
| Version | 0 |
| Summary | Histone_ChIP-seq ENCSR694LBI [biosample_summary="Homo sapiens neuronal stem cell originated from H1" and target="H3K27me3"] |
| Description |
status: released biological_replicates: Rep 1, Rep 2 summary: male embryo output_type: pseudoreplicated peaks audit_internal_action: Released analysis {ENCAN496SMW|/analyses/ENCAN496SMW/} has in progress subobject quality standard {encode4-histone-chip|/quality-standards/encode4-histone-chip/} audit_internal_action: Released analysis {ENCAN496SMW|/analyses/ENCAN496SMW/} has in progress subobject document {4c2927b2-4073-4a2f-b7a9-fb1a7a3f7257|/documents/4c2927b2-4073-4a2f-b7a9-fb1a7a3f7257/} audit_not_compliant: Processed alignments file {ENCFF391VPZ|/files/ENCFF391VPZ/} processed by ChIP-seq ENCODE4 v1.6.1 GRCh38 pipeline has 16670228 usable fragments. The minimum ENCODE standard for each replicate in a ChIP-seq experiment targeting H3K27me3-human and investigated as a broad histone mark is 20 million usable fragments. The recommended value is > 45 million, but > 35 million is acceptable. (See {ENCODE ChIP-seq data standards|/data-standards/chip-seq/}) audit_warning: PBC1 (PCR Bottlenecking Coefficient 1, M1/M_distinct) is the ratio of the number of genomic locations where exactly one read maps uniquely (M1) to the number of genomic locations where some reads map (M_distinct). A PBC1 value in the range 0 - 0.5 is severe bottlenecking, 0.5 - 0.8 is moderate bottlenecking, 0.8 - 0.9 is mild bottlenecking, and > 0.9 is no bottlenecking. PBC1 value > 0.9 is recommended, but > 0.8 is acceptable. ENCODE processed alignments file {ENCFF683OOP|/files/ENCFF683OOP/} processed by ChIP-seq ENCODE4 v1.6.1 GRCh38 pipeline was generated from a library with PBC1 value of 0.90. audit_warning: PBC2 (PCR Bottlenecking Coefficient 2, M1/M2) is the ratio of the number of genomic locations where exactly one read maps uniquely (M1) to the number of genomic locations where two reads map uniquely (M2). A PBC2 value in the range 0 - 1 is severe bottlenecking, 1 - 3 is moderate bottlenecking, 3 - 10 is mild bottlenecking, > 10 is no bottlenecking. PBC2 value > 10 is recommended, but > 3 is acceptable. ENCODE processed alignments file {ENCFF683OOP|/files/ENCFF683OOP/} processed by ChIP-seq ENCODE4 v1.6.1 GRCh38 pipeline was generated from a library with PBC2 value of 9.55. audit_warning: PBC1 (PCR Bottlenecking Coefficient 1, M1/M_distinct) is the ratio of the number of genomic locations where exactly one read maps uniquely (M1) to the number of genomic locations where some reads map (M_distinct). A PBC1 value in the range 0 - 0.5 is severe bottlenecking, 0.5 - 0.8 is moderate bottlenecking, 0.8 - 0.9 is mild bottlenecking, and > 0.9 is no bottlenecking. PBC1 value > 0.9 is recommended, but > 0.8 is acceptable. ENCODE processed alignments file {ENCFF391VPZ|/files/ENCFF391VPZ/} processed by ChIP-seq ENCODE4 v1.6.1 GRCh38 pipeline was generated from a library with PBC1 value of 0.83. audit_warning: PBC2 (PCR Bottlenecking Coefficient 2, M1/M2) is the ratio of the number of genomic locations where exactly one read maps uniquely (M1) to the number of genomic locations where two reads map uniquely (M2). A PBC2 value in the range 0 - 1 is severe bottlenecking, 1 - 3 is moderate bottlenecking, 3 - 10 is mild bottlenecking, > 10 is no bottlenecking. PBC2 value > 10 is recommended, but > 3 is acceptable. ENCODE processed alignments file {ENCFF391VPZ|/files/ENCFF391VPZ/} processed by ChIP-seq ENCODE4 v1.6.1 GRCh38 pipeline was generated from a library with PBC2 value of 5.88. |
| Labels |
|
Scores (1)
| ID | Type | Default annotation | Description | Histogram | Range | Summary |
|---|---|---|---|---|---|---|
| Histone_ChIP-seq_ENCSR694LBI | float |
Histone_ChIP-seq_ENCSR694LBI |
Histone_ChIP-seq ENCSR694LBI [biosample_summary="Homo sapiens neuronal stem cell originated from H1" and target="H3K27me3"]
|
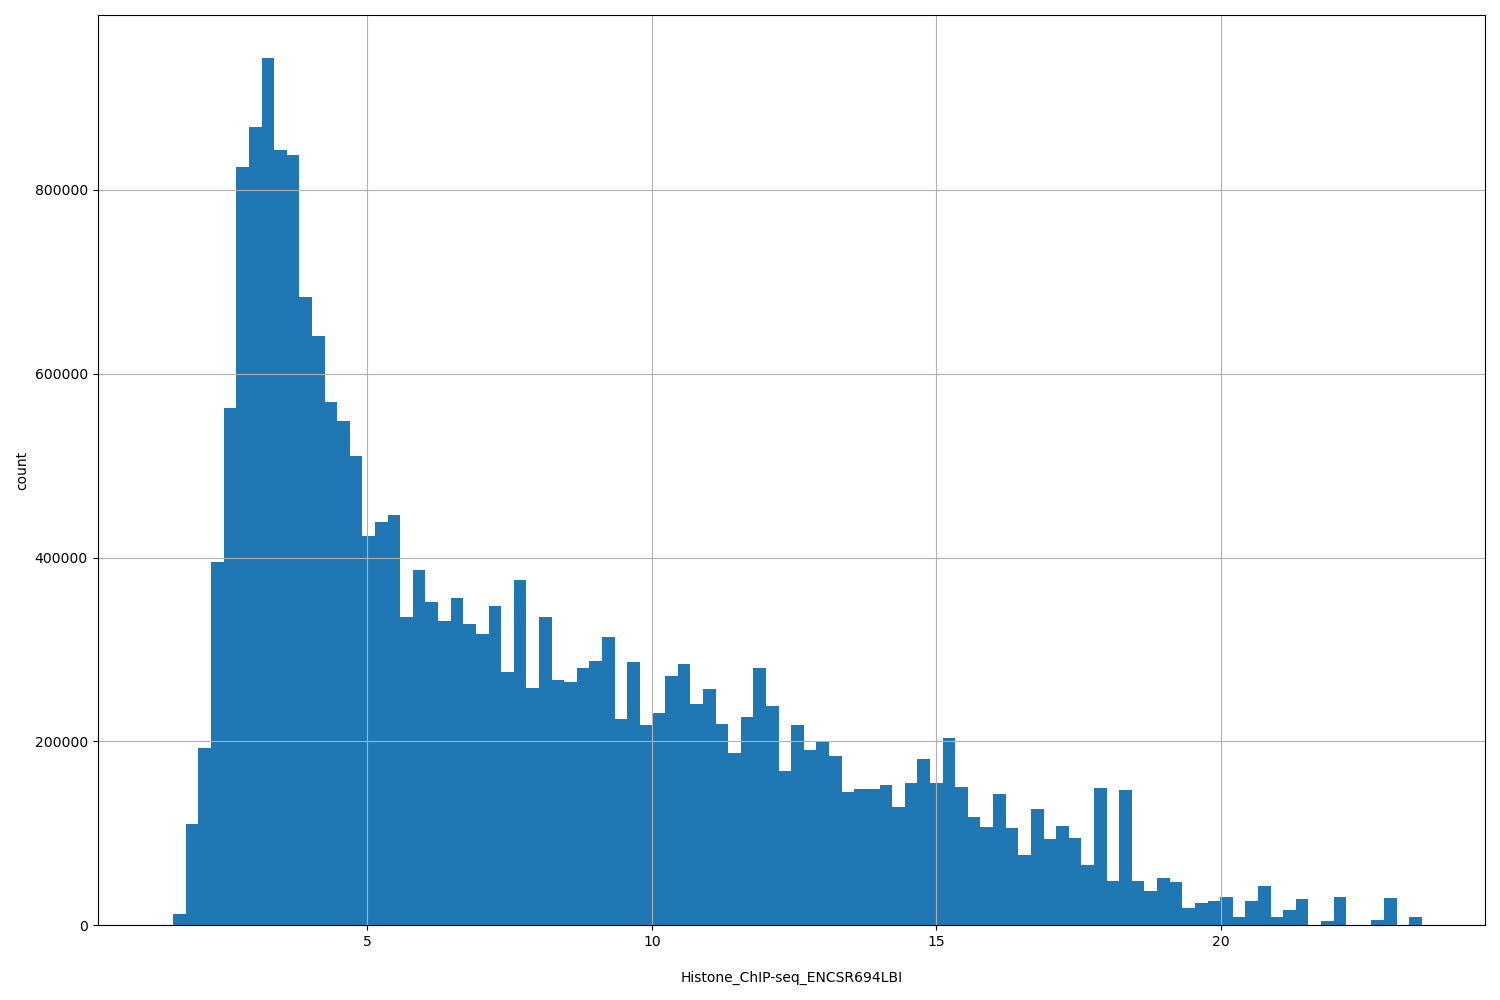 |
[1.36, 23.5] |
|
n counts base pairs; sd is the population standard deviation.
Coverage
| Chromosome | Covered positions | Covered % | Segments |
|---|---|---|---|
| all chromosomes | 22835805 | 0.71% | 33193 |
| chr1 | 2204918 | 0.89% | 3322 |
| chr2 | 1743223 | 0.72% | 2482 |
| chr3 | 900153 | 0.45% | 1531 |
| chr4 | 959995 | 0.50% | 1285 |
| chr5 | 1273377 | 0.70% | 1851 |
| chr6 | 1171364 | 0.69% | 1699 |
| chr7 | 1108376 | 0.70% | 1522 |
| chr8 | 913629 | 0.63% | 1316 |
| chr9 | 1019447 | 0.74% | 1534 |
| chr10 | 1264138 | 0.94% | 1764 |
| chr11 | 1184190 | 0.88% | 1788 |
| chr12 | 1140729 | 0.86% | 1564 |
| chr13 | 411585 | 0.36% | 627 |
| chr14 | 666570 | 0.62% | 980 |
| chr15 | 761118 | 0.75% | 1155 |
| chr16 | 898169 | 0.99% | 1287 |
| chr17 | 1481202 | 1.78% | 1958 |
| chr18 | 380832 | 0.47% | 576 |
| chr19 | 1320977 | 2.25% | 1842 |
| chr20 | 796905 | 1.24% | 1198 |
| chr21 | 257756 | 0.55% | 380 |
| chr22 | 635082 | 1.25% | 1063 |
| chrX | 341405 | 0.22% | 466 |
| chrY | 665 | <0.01% | 3 |
| 3342 contigs with no values (129077085 bp) | 0 | 0.00% | 0 |
Segment lengths
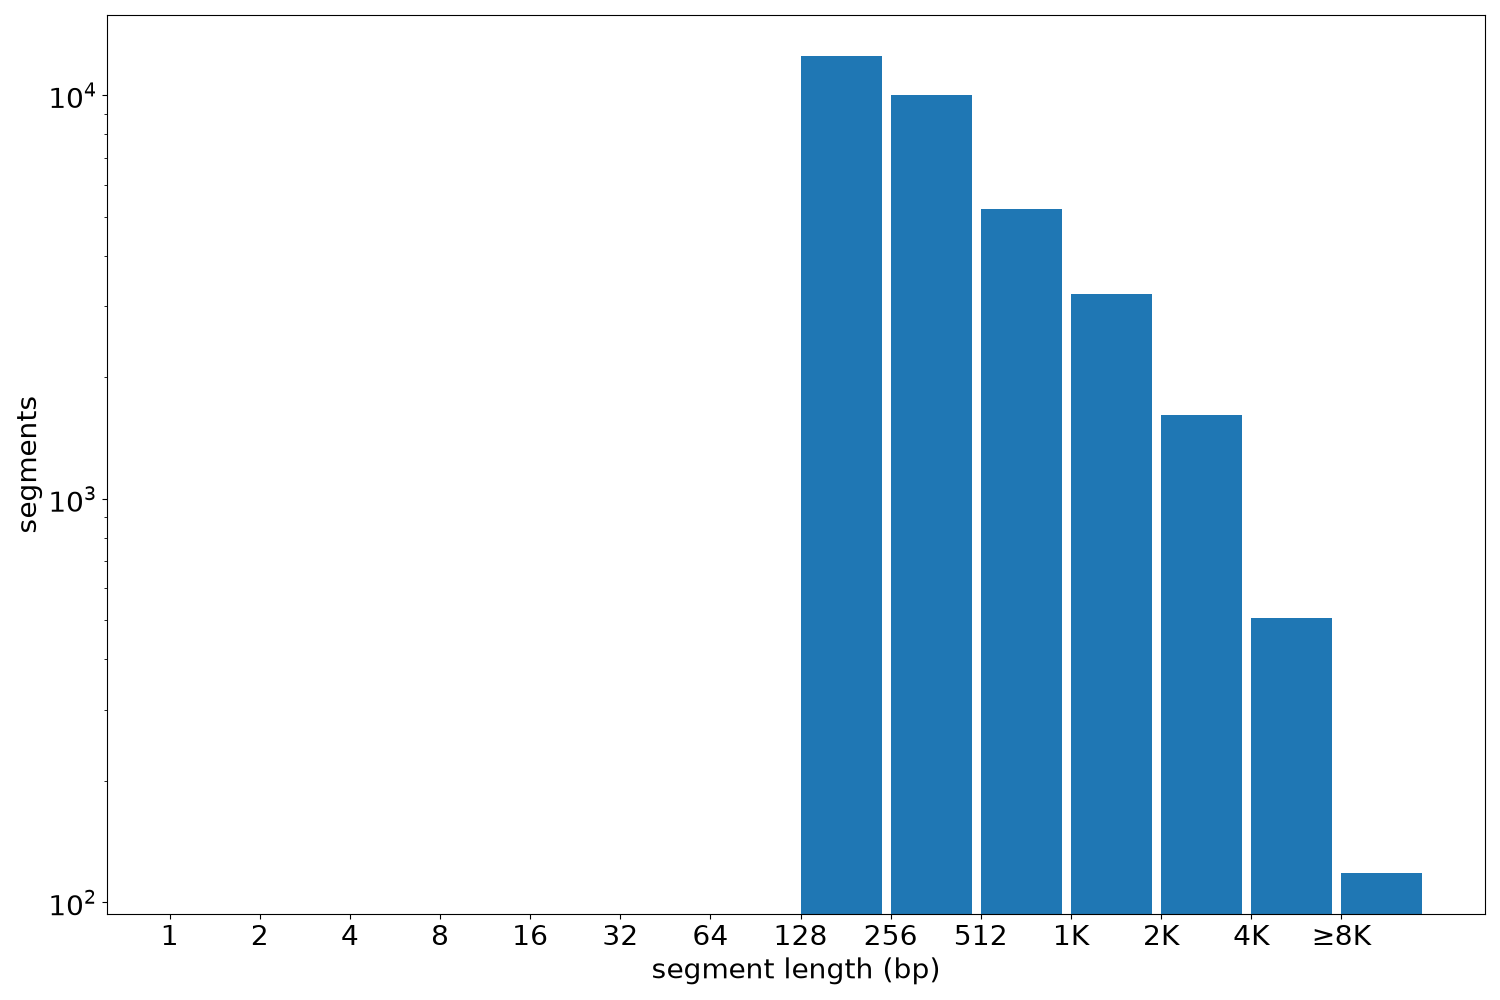
| segments | min | max | mean | median | |
|---|---|---|---|---|---|
| segments | 33193 | 135 | 28292 | 687.97 | 322 |
Files
| Filename | Size | md5 |
|---|---|---|
| ENCFF573HEY.bed.gz | 763.43 KB | 37239cdbac41ee94f63879931091739b |
| ENCFF573HEY.tabix.bed.gz | 349.39 KB | c57f903d01a21080d654f77dd09c28d6 |
| ENCFF573HEY.tabix.bed.gz.tbi | 125.73 KB | 8df4b55d6730b39828f9ba03eac14963 |
| genomic_resource.yaml | 4.73 KB | 65dca6e59ce581145f150c9fa81e407a |
| statistics/ |