Resource
| Id | Histone_ChIP-seq/ENCSR668GBL |
|---|---|
| Type | position_score |
| Version | 0 |
| Summary | Histone_ChIP-seq ENCSR668GBL [biosample_summary="Homo sapiens spleen tissue female adult (51 years)" and target="H3K27ac"] |
| Description |
status: released biological_replicates: Rep 1, Rep 2 summary: female adult (51 years) output_type: pseudoreplicated peaks audit_internal_action: Released analysis {ENCAN159POY|/analyses/ENCAN159POY/} has in progress subobject quality standard {encode4-histone-chip|/quality-standards/encode4-histone-chip/} audit_internal_action: Released analysis {ENCAN159POY|/analyses/ENCAN159POY/} has in progress subobject document {21b78a1e-6133-408a-ab2f-4a09f1313913|/documents/21b78a1e-6133-408a-ab2f-4a09f1313913/} audit_warning: PBC1 (PCR Bottlenecking Coefficient 1, M1/M_distinct) is the ratio of the number of genomic locations where exactly one read maps uniquely (M1) to the number of genomic locations where some reads map (M_distinct). A PBC1 value in the range 0 - 0.5 is severe bottlenecking, 0.5 - 0.8 is moderate bottlenecking, 0.8 - 0.9 is mild bottlenecking, and > 0.9 is no bottlenecking. PBC1 value > 0.9 is recommended, but > 0.8 is acceptable. ENCODE processed alignments file {ENCFF772PQB|/files/ENCFF772PQB/} processed by ChIP-seq ENCODE4 v1.5.1 GRCh38 pipeline was generated from a library with PBC1 value of 0.90. audit_warning: PBC2 (PCR Bottlenecking Coefficient 2, M1/M2) is the ratio of the number of genomic locations where exactly one read maps uniquely (M1) to the number of genomic locations where two reads map uniquely (M2). A PBC2 value in the range 0 - 1 is severe bottlenecking, 1 - 3 is moderate bottlenecking, 3 - 10 is mild bottlenecking, > 10 is no bottlenecking. PBC2 value > 10 is recommended, but > 3 is acceptable. ENCODE processed alignments file {ENCFF772PQB|/files/ENCFF772PQB/} processed by ChIP-seq ENCODE4 v1.5.1 GRCh38 pipeline was generated from a library with PBC2 value of 9.95. |
| Labels |
|
Scores (1)
| ID | Type | Default annotation | Description | Histogram | Range | Summary |
|---|---|---|---|---|---|---|
| Histone_ChIP-seq_ENCSR668GBL | float |
Histone_ChIP-seq_ENCSR668GBL |
Histone_ChIP-seq ENCSR668GBL [biosample_summary="Homo sapiens spleen tissue female adult (51 years)" and target="H3K27ac"]
|
 |
[1.58, 74.8] |
|
n counts base pairs; sd is the population standard deviation.
Coverage
| Chromosome | Covered positions | Covered % | Segments |
|---|---|---|---|
| all chromosomes | 134564007 | 4.18% | 72480 |
| chr1 | 13179524 | 5.29% | 6954 |
| chr2 | 10594893 | 4.37% | 5833 |
| chr3 | 8407250 | 4.24% | 4746 |
| chr4 | 5364157 | 2.82% | 3074 |
| chr5 | 6543103 | 3.60% | 3529 |
| chr6 | 7485067 | 4.38% | 4104 |
| chr7 | 6335657 | 3.98% | 3635 |
| chr8 | 5453000 | 3.76% | 3013 |
| chr9 | 5839046 | 4.22% | 3166 |
| chr10 | 6544590 | 4.89% | 3481 |
| chr11 | 7145946 | 5.29% | 3630 |
| chr12 | 6992826 | 5.25% | 3648 |
| chr13 | 2865935 | 2.51% | 1669 |
| chr14 | 4975145 | 4.65% | 2543 |
| chr15 | 4623767 | 4.53% | 2476 |
| chr16 | 4737824 | 5.24% | 2605 |
| chr17 | 7337802 | 8.81% | 3646 |
| chr18 | 2367389 | 2.95% | 1370 |
| chr19 | 6132906 | 10.46% | 2984 |
| chr20 | 3855058 | 5.98% | 2051 |
| chr21 | 1648360 | 3.53% | 918 |
| chr22 | 3293762 | 6.48% | 1693 |
| chrX | 2841000 | 1.82% | 1712 |
| 3343 contigs with no values (186304500 bp) | 0 | 0.00% | 0 |
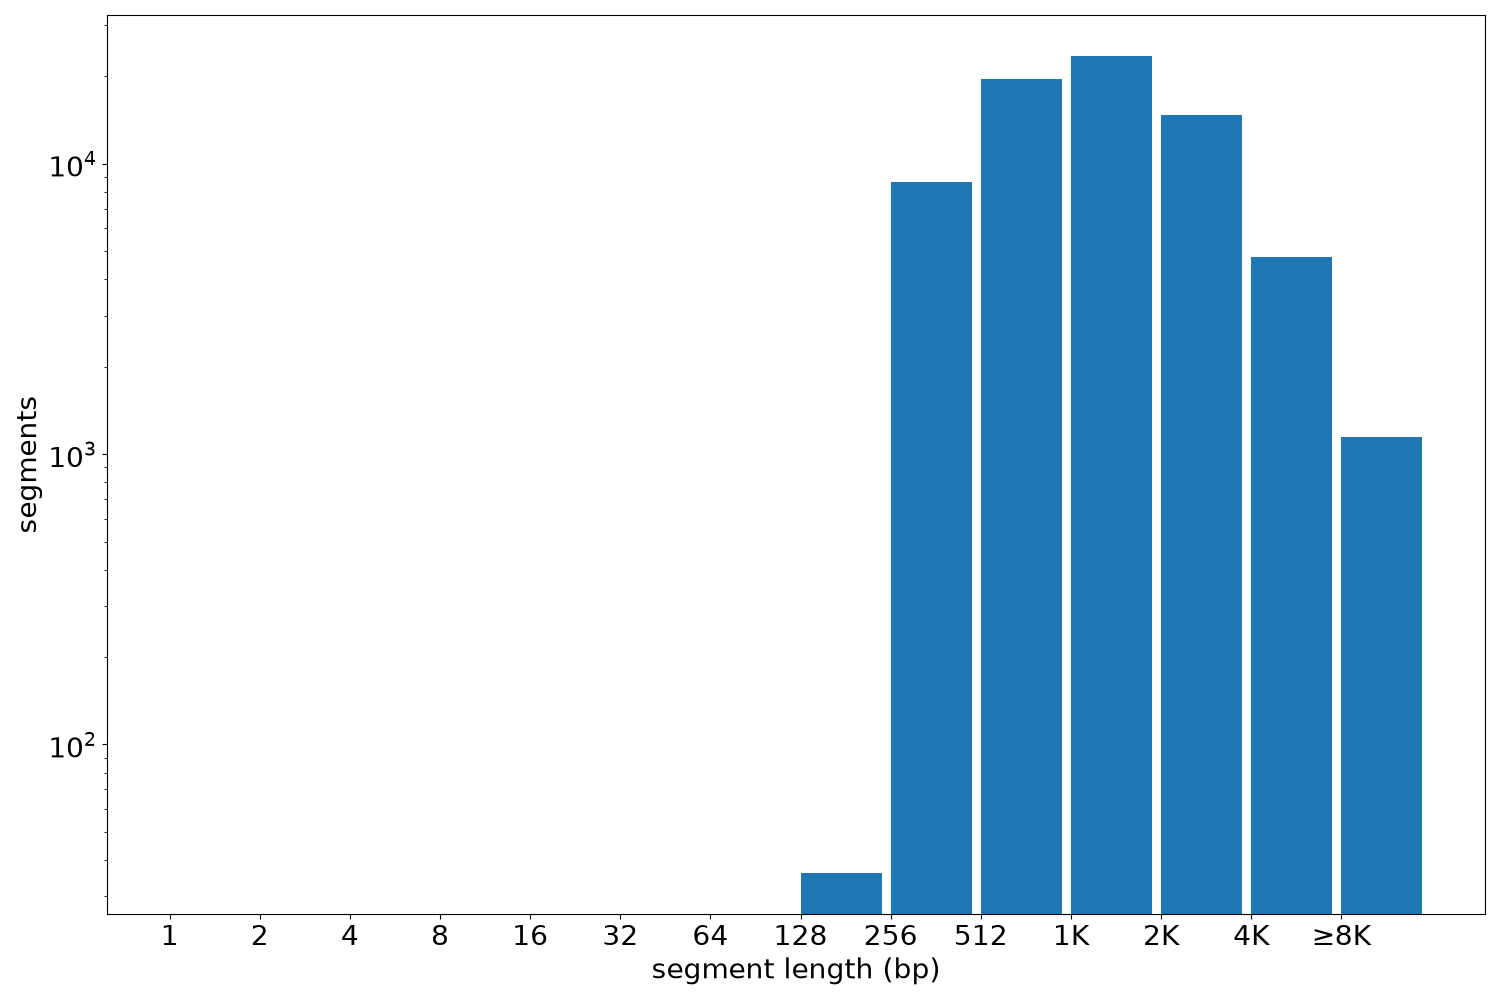
Segment lengths
| segments | min | max | mean | median | |
|---|---|---|---|---|---|
| segments | 72480 | 243 | 74914 | 1856.57 | 1302 |
Files
| Filename | Size | md5 |
|---|---|---|
| ENCFF214NTL.bed.gz | 1.86 MB | 062a513a34d087df5726c43c2207e41d |
| ENCFF214NTL.tabix.bed.gz | 814.91 KB | ab783c01acd65bc66c82452545e67429 |
| ENCFF214NTL.tabix.bed.gz.tbi | 247.39 KB | 61fe3ac3bd673a2001e7782fd69ab219 |
| genomic_resource.yaml | 2.98 KB | 8e4b29a7a0f06b329f697f4fa97d64bb |
| statistics/ |