Resource
| Id | Histone_ChIP-seq/ENCSR645FBM |
|---|---|
| Type | position_score |
| Version | 0 |
| Summary | Histone_ChIP-seq ENCSR645FBM [biosample_summary="Homo sapiens ascending aorta tissue female adult (51 years)" and target="H3K4me3"] |
| Description |
status: released biological_replicates: Rep 1 summary: female adult (51 years) output_type: pseudoreplicated peaks audit_internal_action: Released analysis {ENCAN216NAX|/analyses/ENCAN216NAX/} has in progress subobject quality standard {encode4-histone-chip|/quality-standards/encode4-histone-chip/} audit_internal_action: Released analysis {ENCAN216NAX|/analyses/ENCAN216NAX/} has in progress subobject document {a825291f-1dd9-4f7d-9fe3-2224ca3c9834|/documents/a825291f-1dd9-4f7d-9fe3-2224ca3c9834/} audit_warning: PBC1 (PCR Bottlenecking Coefficient 1, M1/M_distinct) is the ratio of the number of genomic locations where exactly one read maps uniquely (M1) to the number of genomic locations where some reads map (M_distinct). A PBC1 value in the range 0 - 0.5 is severe bottlenecking, 0.5 - 0.8 is moderate bottlenecking, 0.8 - 0.9 is mild bottlenecking, and > 0.9 is no bottlenecking. PBC1 value > 0.9 is recommended, but > 0.8 is acceptable. ENCODE processed alignments file {ENCFF762HPH|/files/ENCFF762HPH/} processed by ChIP-seq ENCODE4 v1.5.1 GRCh38 pipeline was generated from a library with PBC1 value of 0.88. audit_warning: PBC2 (PCR Bottlenecking Coefficient 2, M1/M2) is the ratio of the number of genomic locations where exactly one read maps uniquely (M1) to the number of genomic locations where two reads map uniquely (M2). A PBC2 value in the range 0 - 1 is severe bottlenecking, 1 - 3 is moderate bottlenecking, 3 - 10 is mild bottlenecking, > 10 is no bottlenecking. PBC2 value > 10 is recommended, but > 3 is acceptable. ENCODE processed alignments file {ENCFF762HPH|/files/ENCFF762HPH/} processed by ChIP-seq ENCODE4 v1.5.1 GRCh38 pipeline was generated from a library with PBC2 value of 9.19. |
| Labels |
|
Scores (1)
| ID | Type | Default annotation | Description | Histogram | Range | Summary |
|---|---|---|---|---|---|---|
| Histone_ChIP-seq_ENCSR645FBM | float |
Histone_ChIP-seq_ENCSR645FBM |
Histone_ChIP-seq ENCSR645FBM [biosample_summary="Homo sapiens ascending aorta tissue female adult (51 years)" and target="H3K4me3"]
|
 |
[1.61, 59.5] |
|
n counts base pairs; sd is the population standard deviation.
Coverage
| Chromosome | Covered positions | Covered % | Segments |
|---|---|---|---|
| all chromosomes | 65005288 | 2.02% | 39749 |
| chr1 | 6432910 | 2.58% | 3879 |
| chr2 | 4614725 | 1.91% | 2880 |
| chr3 | 3893901 | 1.96% | 2368 |
| chr4 | 2792814 | 1.47% | 1701 |
| chr5 | 3172555 | 1.75% | 1982 |
| chr6 | 3807231 | 2.23% | 2318 |
| chr7 | 3154293 | 1.98% | 1988 |
| chr8 | 2469530 | 1.70% | 1584 |
| chr9 | 2790946 | 2.02% | 1716 |
| chr10 | 3083522 | 2.30% | 2044 |
| chr11 | 3503711 | 2.59% | 1996 |
| chr12 | 3496955 | 2.62% | 2081 |
| chr13 | 1432370 | 1.25% | 924 |
| chr14 | 2008984 | 1.88% | 1205 |
| chr15 | 2141096 | 2.10% | 1324 |
| chr16 | 2448885 | 2.71% | 1484 |
| chr17 | 3471732 | 4.17% | 2033 |
| chr18 | 1145998 | 1.43% | 741 |
| chr19 | 3601424 | 6.14% | 2088 |
| chr20 | 1656351 | 2.57% | 1028 |
| chr21 | 665410 | 1.42% | 459 |
| chr22 | 1402234 | 2.76% | 840 |
| chrX | 1817711 | 1.16% | 1086 |
| 3343 contigs with no values (186304500 bp) | 0 | 0.00% | 0 |
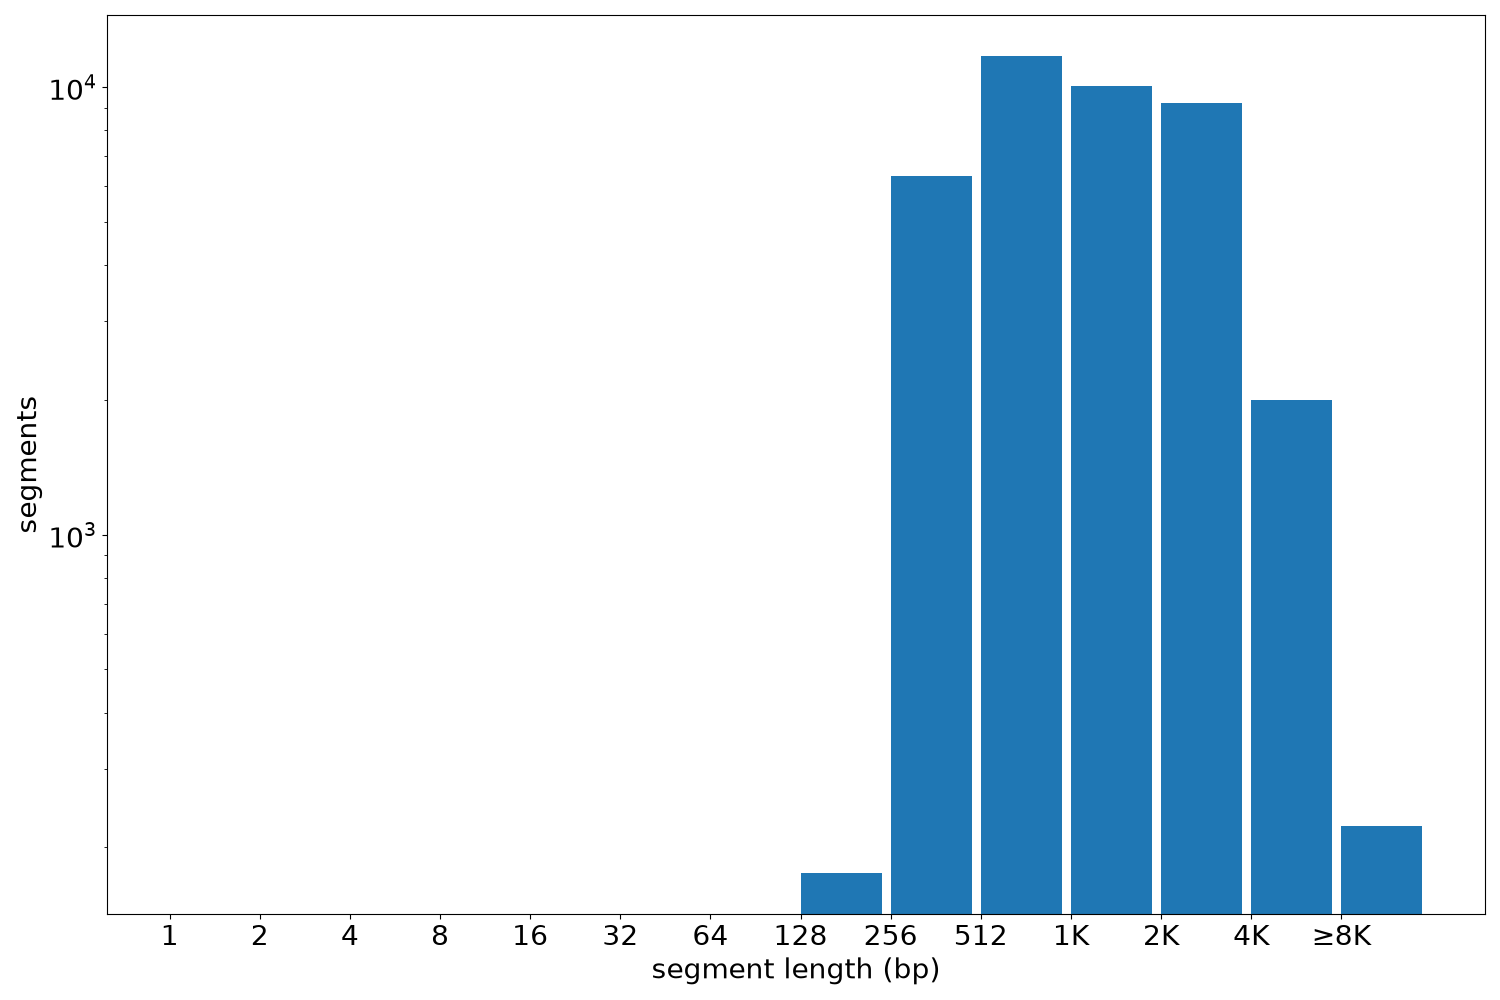
Segment lengths
| segments | min | max | mean | median | |
|---|---|---|---|---|---|
| segments | 39749 | 210 | 26659 | 1635.39 | 1129 |
Files
| Filename | Size | md5 |
|---|---|---|
| ENCFF391SLS.bed.gz | 1.06 MB | 0eb410e9c4ffc056a41c9f51675066c7 |
| ENCFF391SLS.tabix.bed.gz | 461.17 KB | 94d4576c59eceffc9cff1c1c7b21e57d |
| ENCFF391SLS.tabix.bed.gz.tbi | 212.51 KB | 7418ae7627b428c0a36e113be907c58a |
| genomic_resource.yaml | 3.0 KB | c2dab004334370bf84e9b619b72553e8 |
| statistics/ |