Resource
| Id | Histone_ChIP-seq/ENCSR604III |
|---|---|
| Type | position_score |
| Version | 0 |
| Summary | Histone_ChIP-seq ENCSR604III [biosample_summary="Homo sapiens Karpas-422" and target="H3K79me2"] |
| Description |
status: released biological_replicates: Rep 1, Rep 2 summary: output_type: pseudoreplicated peaks audit_internal_action: Released analysis {ENCAN952JJA|/analyses/ENCAN952JJA/} has in progress subobject quality standard {encode4-histone-chip|/quality-standards/encode4-histone-chip/} audit_internal_action: Released analysis {ENCAN952JJA|/analyses/ENCAN952JJA/} has in progress subobject document {9f8f73bd-944a-45a6-b8b1-557a6ad1d0b5|/documents/9f8f73bd-944a-45a6-b8b1-557a6ad1d0b5/} audit_warning: PBC1 (PCR Bottlenecking Coefficient 1, M1/M_distinct) is the ratio of the number of genomic locations where exactly one read maps uniquely (M1) to the number of genomic locations where some reads map (M_distinct). A PBC1 value in the range 0 - 0.5 is severe bottlenecking, 0.5 - 0.8 is moderate bottlenecking, 0.8 - 0.9 is mild bottlenecking, and > 0.9 is no bottlenecking. PBC1 value > 0.9 is recommended, but > 0.8 is acceptable. ENCODE processed alignments file {ENCFF270OIQ|/files/ENCFF270OIQ/} processed by ChIP-seq ENCODE4 v1.6.1 GRCh38 pipeline was generated from a library with PBC1 value of 0.85. audit_warning: PBC2 (PCR Bottlenecking Coefficient 2, M1/M2) is the ratio of the number of genomic locations where exactly one read maps uniquely (M1) to the number of genomic locations where two reads map uniquely (M2). A PBC2 value in the range 0 - 1 is severe bottlenecking, 1 - 3 is moderate bottlenecking, 3 - 10 is mild bottlenecking, > 10 is no bottlenecking. PBC2 value > 10 is recommended, but > 3 is acceptable. ENCODE processed alignments file {ENCFF270OIQ|/files/ENCFF270OIQ/} processed by ChIP-seq ENCODE4 v1.6.1 GRCh38 pipeline was generated from a library with PBC2 value of 6.54. |
| Labels |
|
Scores (1)
| ID | Type | Default annotation | Description | Histogram | Range | Summary |
|---|---|---|---|---|---|---|
| Histone_ChIP-seq_ENCSR604III | float |
Histone_ChIP-seq_ENCSR604III |
Histone_ChIP-seq ENCSR604III [biosample_summary="Homo sapiens Karpas-422" and target="H3K79me2"]
|
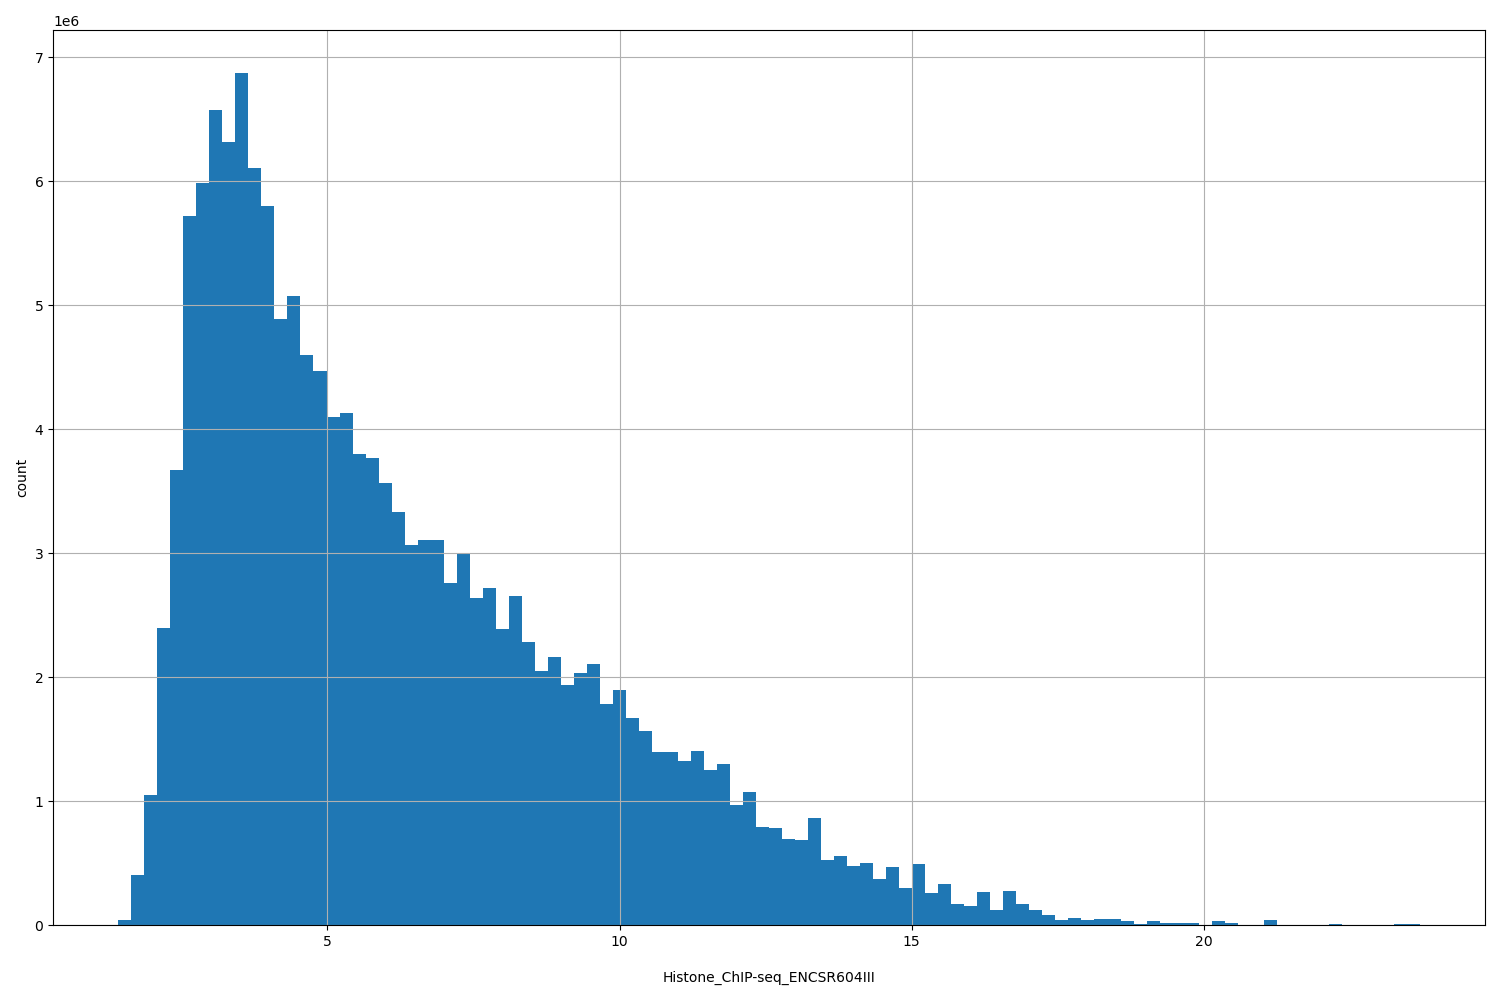 |
[1.42, 23.7] |
|
n counts base pairs; sd is the population standard deviation.
Coverage
| Chromosome | Covered positions | Covered % | Segments |
|---|---|---|---|
| all chromosomes | 157822923 | 4.91% | 109353 |
| chr1 | 14262325 | 5.73% | 10153 |
| chr2 | 12526880 | 5.17% | 8508 |
| chr3 | 12134717 | 6.12% | 7963 |
| chr4 | 7335225 | 3.86% | 5289 |
| chr5 | 8569663 | 4.72% | 5948 |
| chr6 | 8668792 | 5.08% | 6018 |
| chr7 | 8958157 | 5.62% | 5954 |
| chr8 | 7092942 | 4.89% | 4726 |
| chr9 | 6726053 | 4.86% | 4919 |
| chr10 | 6770236 | 5.06% | 4738 |
| chr11 | 7275502 | 5.39% | 4937 |
| chr12 | 7881987 | 5.91% | 5529 |
| chr13 | 4039123 | 3.53% | 2779 |
| chr14 | 5997734 | 5.60% | 3862 |
| chr15 | 6080288 | 5.96% | 3924 |
| chr16 | 5047995 | 5.59% | 3809 |
| chr17 | 6814344 | 8.18% | 4952 |
| chr18 | 3500388 | 4.36% | 2214 |
| chr19 | 5421152 | 9.25% | 4017 |
| chr20 | 4101679 | 6.36% | 2764 |
| chr21 | 1416768 | 3.03% | 970 |
| chr22 | 3159874 | 6.22% | 2249 |
| chrX | 4041099 | 2.59% | 3131 |
| 3343 contigs with no values (186304500 bp) | 0 | 0.00% | 0 |
Segment lengths
| segments | min | max | mean | median | |
|---|---|---|---|---|---|
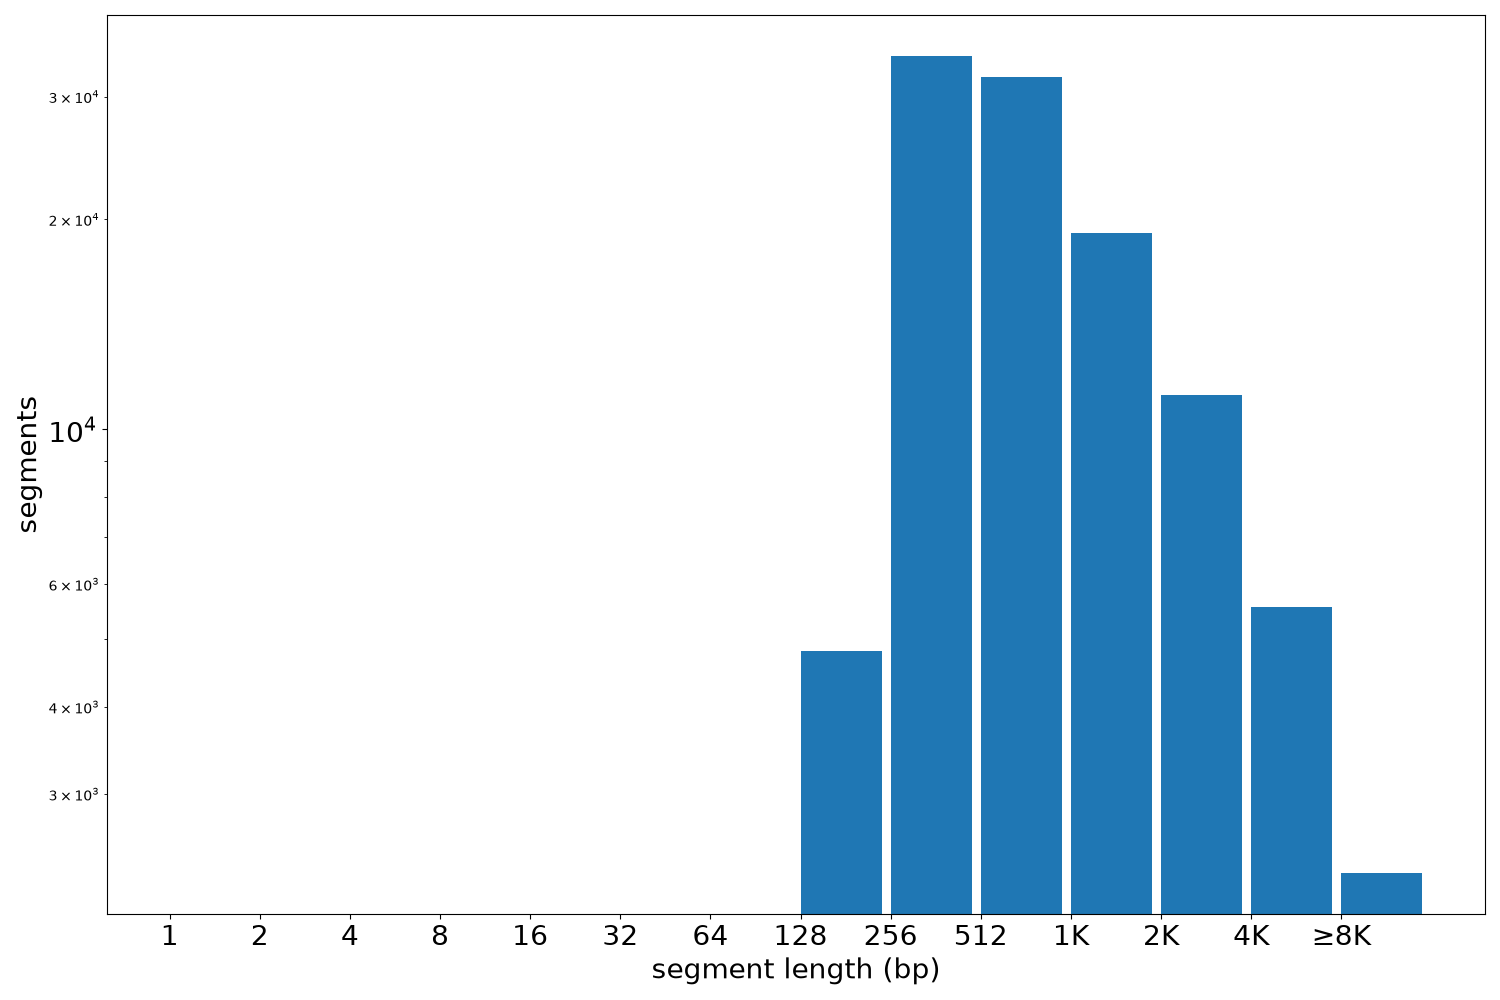
| segments | 109353 | 205 | 64904 | 1443.24 | 689 |
Files
| Filename | Size | md5 |
|---|---|---|
| ENCFF875KRI.bed.gz | 2.65 MB | a6238bec97f87633f5f1d0ed279f1084 |
| ENCFF875KRI.tabix.bed.gz | 1.14 MB | a785d3b5f899f1a5c375f329130bbf38 |
| ENCFF875KRI.tabix.bed.gz.tbi | 117.8 KB | 5766b5a928b323139c078566bd2eac8b |
| genomic_resource.yaml | 2.92 KB | eeaf892adcac585b0e4e9fac320f4aae |
| statistics/ |