Resource
| Id | Histone_ChIP-seq/ENCSR556QXD |
|---|---|
| Type | position_score |
| Version | 0 |
| Summary | Histone_ChIP-seq ENCSR556QXD [biosample_summary="Homo sapiens spleen tissue male adult (37 years)" and target="H3K4me3"] |
| Description |
status: released biological_replicates: Rep 1, Rep 2 summary: male adult (37 years) output_type: pseudoreplicated peaks audit_internal_action: Released analysis {ENCAN656UAE|/analyses/ENCAN656UAE/} has in progress subobject quality standard {encode4-histone-chip|/quality-standards/encode4-histone-chip/} audit_internal_action: Released analysis {ENCAN656UAE|/analyses/ENCAN656UAE/} has in progress subobject document {40d6a9ed-f10d-474d-8fb6-79d57eb095a9|/documents/40d6a9ed-f10d-474d-8fb6-79d57eb095a9/} audit_warning: PBC1 (PCR Bottlenecking Coefficient 1, M1/M_distinct) is the ratio of the number of genomic locations where exactly one read maps uniquely (M1) to the number of genomic locations where some reads map (M_distinct). A PBC1 value in the range 0 - 0.5 is severe bottlenecking, 0.5 - 0.8 is moderate bottlenecking, 0.8 - 0.9 is mild bottlenecking, and > 0.9 is no bottlenecking. PBC1 value > 0.9 is recommended, but > 0.8 is acceptable. ENCODE processed alignments file {ENCFF464ZDR|/files/ENCFF464ZDR/} processed by ChIP-seq ENCODE4 v1.5.1 GRCh38 pipeline was generated from a library with PBC1 value of 0.85. audit_warning: PBC2 (PCR Bottlenecking Coefficient 2, M1/M2) is the ratio of the number of genomic locations where exactly one read maps uniquely (M1) to the number of genomic locations where two reads map uniquely (M2). A PBC2 value in the range 0 - 1 is severe bottlenecking, 1 - 3 is moderate bottlenecking, 3 - 10 is mild bottlenecking, > 10 is no bottlenecking. PBC2 value > 10 is recommended, but > 3 is acceptable. ENCODE processed alignments file {ENCFF464ZDR|/files/ENCFF464ZDR/} processed by ChIP-seq ENCODE4 v1.5.1 GRCh38 pipeline was generated from a library with PBC2 value of 6.74. |
| Labels |
|
Scores (1)
| ID | Type | Default annotation | Description | Histogram | Range | Summary |
|---|---|---|---|---|---|---|
| Histone_ChIP-seq_ENCSR556QXD | float |
Histone_ChIP-seq_ENCSR556QXD |
Histone_ChIP-seq ENCSR556QXD [biosample_summary="Homo sapiens spleen tissue male adult (37 years)" and target="H3K4me3"]
|
 |
[1.7, 108] |
|
n counts base pairs; sd is the population standard deviation.
Coverage
| Chromosome | Covered positions | Covered % | Segments |
|---|---|---|---|
| all chromosomes | 46069540 | 1.43% | 23632 |
| chr1 | 4606902 | 1.85% | 2395 |
| chr2 | 3143668 | 1.30% | 1583 |
| chr3 | 2494227 | 1.26% | 1270 |
| chr4 | 1747414 | 0.92% | 883 |
| chr5 | 2162282 | 1.19% | 1063 |
| chr6 | 2625327 | 1.54% | 1304 |
| chr7 | 2269214 | 1.42% | 1209 |
| chr8 | 1647567 | 1.14% | 854 |
| chr9 | 1885236 | 1.36% | 989 |
| chr10 | 1921524 | 1.44% | 993 |
| chr11 | 2538864 | 1.88% | 1203 |
| chr12 | 2449161 | 1.84% | 1208 |
| chr13 | 905718 | 0.79% | 468 |
| chr14 | 1522430 | 1.42% | 774 |
| chr15 | 1470285 | 1.44% | 775 |
| chr16 | 1857734 | 2.06% | 977 |
| chr17 | 2802710 | 3.37% | 1389 |
| chr18 | 717375 | 0.89% | 396 |
| chr19 | 3234657 | 5.52% | 1715 |
| chr20 | 1245380 | 1.93% | 638 |
| chr21 | 447092 | 0.96% | 245 |
| chr22 | 1093459 | 2.15% | 587 |
| chrX | 1233052 | 0.79% | 689 |
| chrY | 48262 | 0.08% | 25 |
| 3342 contigs with no values (129077085 bp) | 0 | 0.00% | 0 |
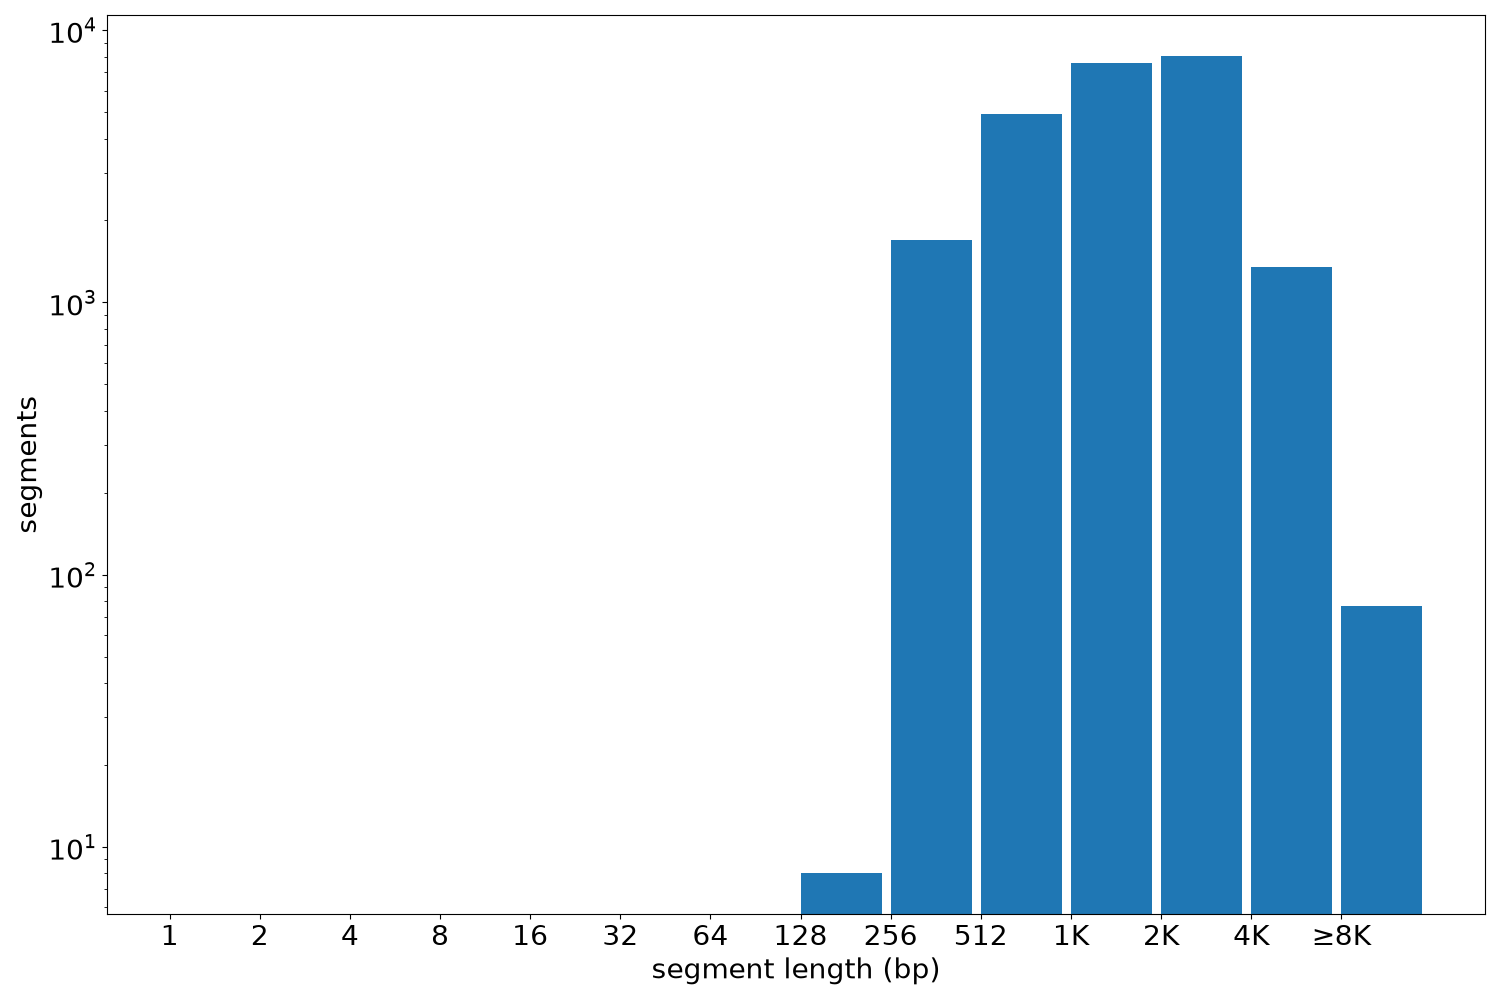
Segment lengths
| segments | min | max | mean | median | |
|---|---|---|---|---|---|
| segments | 23632 | 231 | 16850 | 1949.46 | 1745 |
Files
| Filename | Size | md5 |
|---|---|---|
| ENCFF401XEH.bed.gz | 645.34 KB | a87c9414398f063ae568c97c299331b9 |
| ENCFF401XEH.tabix.bed.gz | 277.41 KB | 606f0e521b8392436125fb20867a2ca7 |
| ENCFF401XEH.tabix.bed.gz.tbi | 151.39 KB | 6688cb0e69404918777acacdccab9a09 |
| genomic_resource.yaml | 2.97 KB | adaeeb976409ae98fc30ada59fed5fbf |
| statistics/ |