Resource
| Id | Histone_ChIP-seq/ENCSR515PKY |
|---|---|
| Type | position_score |
| Version | 0 |
| Summary | Histone_ChIP-seq ENCSR515PKY [biosample_summary="Homo sapiens smooth muscle cell originated from H9" and target="H3K4me3"] |
| Description |
status: released biological_replicates: Rep 1, Rep 2 summary: female embryo (5 days) output_type: replicated peaks audit_internal_action: Archived analysis {ENCAN177SYZ|/analyses/ENCAN177SYZ/} has in progress subobject quality standard {encode3-histone-chip|/quality-standards/encode3-histone-chip/} audit_warning: PBC1 (PCR Bottlenecking Coefficient 1, M1/M_distinct) is the ratio of the number of genomic locations where exactly one read maps uniquely (M1) to the number of genomic locations where some reads map (M_distinct). A PBC1 value in the range 0 - 0.5 is severe bottlenecking, 0.5 - 0.8 is moderate bottlenecking, 0.8 - 0.9 is mild bottlenecking, and > 0.9 is no bottlenecking. PBC1 value > 0.9 is recommended, but > 0.8 is acceptable. ENCODE processed alignments file {ENCFF971VRD|/files/ENCFF971VRD/} processed by ChIP-seq ENCODE3 hg19 pipeline was generated from a library with PBC1 value of 0.84. audit_warning: PBC2 (PCR Bottlenecking Coefficient 2, M1/M2) is the ratio of the number of genomic locations where exactly one read maps uniquely (M1) to the number of genomic locations where two reads map uniquely (M2). A PBC2 value in the range 0 - 1 is severe bottlenecking, 1 - 3 is moderate bottlenecking, 3 - 10 is mild bottlenecking, > 10 is no bottlenecking. PBC2 value > 10 is recommended, but > 3 is acceptable. ENCODE processed alignments file {ENCFF971VRD|/files/ENCFF971VRD/} processed by ChIP-seq ENCODE3 hg19 pipeline was generated from a library with PBC2 value of 6.43. |
| Labels |
|
Scores (1)
| ID | Type | Default annotation | Description | Histogram | Range | Summary |
|---|---|---|---|---|---|---|
| Histone_ChIP-seq_ENCSR515PKY | float |
Histone_ChIP-seq_ENCSR515PKY |
Histone_ChIP-seq ENCSR515PKY [biosample_summary="Homo sapiens smooth muscle cell originated from H9" and target="H3K4me3"]
|
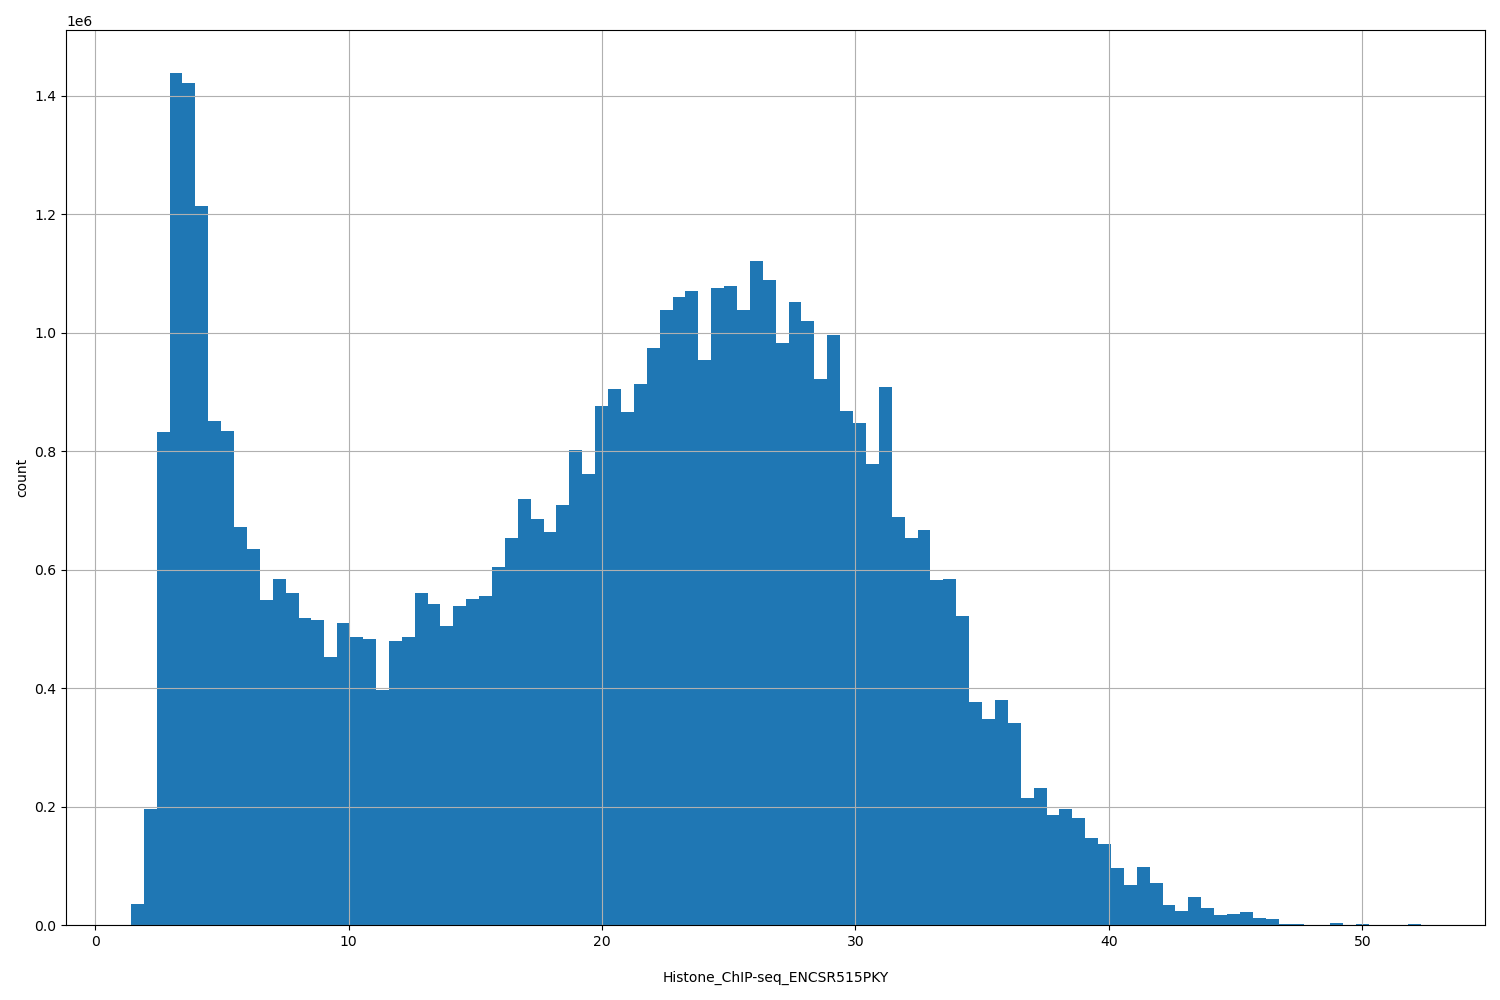 |
[1.41, 52.3] |
|
n counts base pairs; sd is the population standard deviation.
Coverage
| Chromosome | Covered positions | Covered % | Segments |
|---|---|---|---|
| all chromosomes | 52480123 | 1.63% | 32491 |
| chr1 | 5009031 | 2.01% | 3028 |
| chr2 | 3680788 | 1.52% | 2247 |
| chr3 | 3051977 | 1.54% | 1852 |
| chr4 | 2553534 | 1.34% | 1568 |
| chr5 | 2715380 | 1.50% | 1608 |
| chr6 | 3325358 | 1.95% | 1975 |
| chr7 | 2655096 | 1.67% | 1699 |
| chr8 | 2067576 | 1.42% | 1293 |
| chr9 | 2119365 | 1.53% | 1337 |
| chr10 | 2262700 | 1.69% | 1442 |
| chr11 | 2720577 | 2.01% | 1659 |
| chr12 | 2781612 | 2.09% | 1649 |
| chr13 | 1177473 | 1.03% | 759 |
| chr14 | 1694588 | 1.58% | 1009 |
| chr15 | 1672017 | 1.64% | 1022 |
| chr16 | 1827862 | 2.02% | 1193 |
| chr17 | 2723601 | 3.27% | 1624 |
| chr18 | 1021433 | 1.27% | 661 |
| chr19 | 2979543 | 5.08% | 2019 |
| chr20 | 1246442 | 1.93% | 785 |
| chr21 | 526696 | 1.13% | 334 |
| chr22 | 949890 | 1.87% | 624 |
| chrX | 1716436 | 1.10% | 1103 |
| chrY | 1148 | <0.01% | 1 |
| 3342 contigs with no values (129077085 bp) | 0 | 0.00% | 0 |
Segment lengths
| segments | min | max | mean | median | |
|---|---|---|---|---|---|
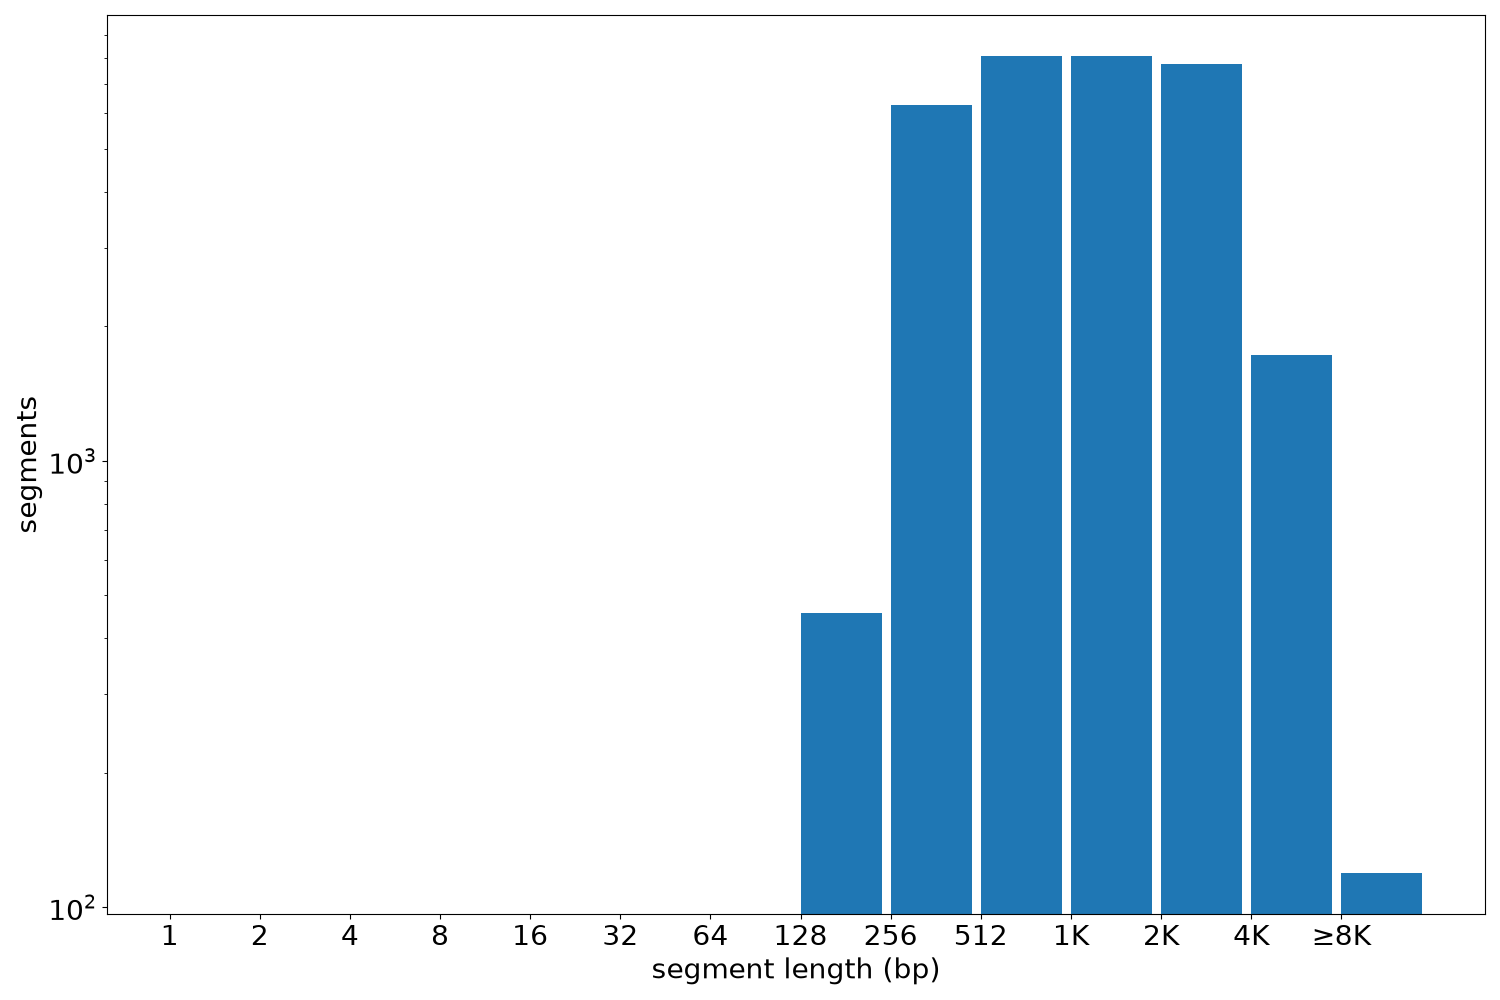
| segments | 32491 | 200 | 28931 | 1615.22 | 1165 |
Files
| Filename | Size | md5 |
|---|---|---|
| ENCFF235XSR.bed.gz | 897.65 KB | 341ebb6c5d38a02fa7e9afba5b601f6d |
| ENCFF235XSR.tabix.bed.gz | 377.39 KB | d7e94ebc83d20029dee92aa832ee570d |
| ENCFF235XSR.tabix.bed.gz.tbi | 192.83 KB | 871f6bc4d57ec866c5ab67f5922ef0c8 |
| genomic_resource.yaml | 2.76 KB | ba9437e8787545be6e1d672f4546deb2 |
| statistics/ |