Resource
| Id | Histone_ChIP-seq/ENCSR509MHV |
|---|---|
| Type | position_score |
| Version | 0 |
| Summary | Histone_ChIP-seq ENCSR509MHV [biosample_summary="Homo sapiens mesenchymal stem cell originated from H1" and target="H4K91ac"] |
| Description |
status: released biological_replicates: Rep 1 summary: male embryo output_type: pseudoreplicated peaks audit_internal_action: Released analysis {ENCAN107SPT|/analyses/ENCAN107SPT/} has in progress subobject quality standard {encode4-histone-chip|/quality-standards/encode4-histone-chip/} audit_internal_action: Released analysis {ENCAN107SPT|/analyses/ENCAN107SPT/} has in progress subobject document {94c9458f-11c2-4d04-b776-2b9fb859eded|/documents/94c9458f-11c2-4d04-b776-2b9fb859eded/} audit_warning: PBC1 (PCR Bottlenecking Coefficient 1, M1/M_distinct) is the ratio of the number of genomic locations where exactly one read maps uniquely (M1) to the number of genomic locations where some reads map (M_distinct). A PBC1 value in the range 0 - 0.5 is severe bottlenecking, 0.5 - 0.8 is moderate bottlenecking, 0.8 - 0.9 is mild bottlenecking, and > 0.9 is no bottlenecking. PBC1 value > 0.9 is recommended, but > 0.8 is acceptable. ENCODE processed alignments file {ENCFF377OEI|/files/ENCFF377OEI/} processed by ChIP-seq ENCODE4 v1.6.1 GRCh38 pipeline was generated from a library with PBC1 value of 0.84. audit_warning: PBC2 (PCR Bottlenecking Coefficient 2, M1/M2) is the ratio of the number of genomic locations where exactly one read maps uniquely (M1) to the number of genomic locations where two reads map uniquely (M2). A PBC2 value in the range 0 - 1 is severe bottlenecking, 1 - 3 is moderate bottlenecking, 3 - 10 is mild bottlenecking, > 10 is no bottlenecking. PBC2 value > 10 is recommended, but > 3 is acceptable. ENCODE processed alignments file {ENCFF377OEI|/files/ENCFF377OEI/} processed by ChIP-seq ENCODE4 v1.6.1 GRCh38 pipeline was generated from a library with PBC2 value of 7.29. |
| Labels |
|
Scores (1)
| ID | Type | Default annotation | Description | Histogram | Range | Summary |
|---|---|---|---|---|---|---|
| Histone_ChIP-seq_ENCSR509MHV | float |
Histone_ChIP-seq_ENCSR509MHV |
Histone_ChIP-seq ENCSR509MHV [biosample_summary="Homo sapiens mesenchymal stem cell originated from H1" and target="H4K91ac"]
|
 |
[1.79, 26.5] |
|
n counts base pairs; sd is the population standard deviation.
Coverage
| Chromosome | Covered positions | Covered % | Segments |
|---|---|---|---|
| all chromosomes | 30384156 | 0.94% | 107466 |
| chr1 | 2809994 | 1.13% | 9889 |
| chr2 | 2512929 | 1.04% | 8963 |
| chr3 | 1550601 | 0.78% | 5768 |
| chr4 | 1014808 | 0.53% | 3904 |
| chr5 | 1476227 | 0.81% | 5414 |
| chr6 | 1348513 | 0.79% | 5134 |
| chr7 | 1399208 | 0.88% | 5217 |
| chr8 | 1382563 | 0.95% | 5079 |
| chr9 | 1594534 | 1.15% | 5379 |
| chr10 | 1677352 | 1.25% | 5969 |
| chr11 | 1778928 | 1.32% | 5953 |
| chr12 | 1346571 | 1.01% | 4764 |
| chr13 | 657081 | 0.57% | 2512 |
| chr14 | 928359 | 0.87% | 3225 |
| chr15 | 1027605 | 1.01% | 3616 |
| chr16 | 1399735 | 1.55% | 4548 |
| chr17 | 1879375 | 2.26% | 6152 |
| chr18 | 548581 | 0.68% | 2191 |
| chr19 | 1425897 | 2.43% | 4706 |
| chr20 | 943562 | 1.46% | 3240 |
| chr21 | 455821 | 0.98% | 1512 |
| chr22 | 892774 | 1.76% | 2935 |
| chrX | 324627 | 0.21% | 1358 |
| chrY | 8511 | 0.01% | 38 |
| 3342 contigs with no values (129077085 bp) | 0 | 0.00% | 0 |
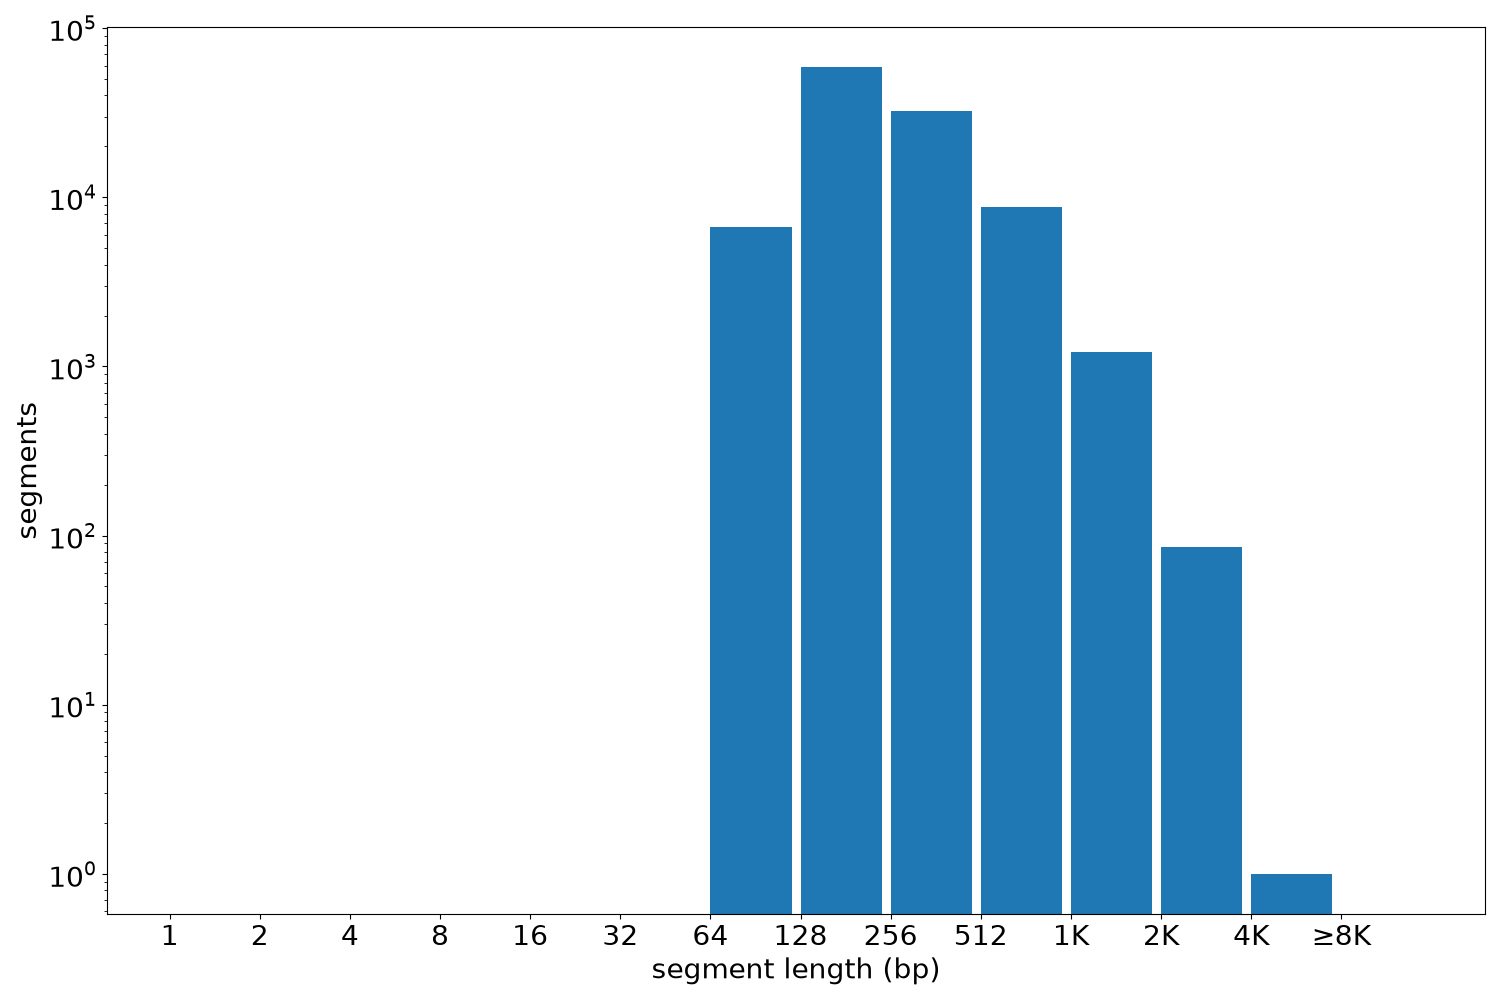
Segment lengths
| segments | min | max | mean | median | |
|---|---|---|---|---|---|
| segments | 107466 | 120 | 4653 | 282.73 | 220 |
Files
| Filename | Size | md5 |
|---|---|---|
| ENCFF180NUC.bed.gz | 2.13 MB | 72b9508700a4fded7130c7f6db320285 |
| ENCFF180NUC.tabix.bed.gz | 1.03 MB | 4814f5e396b011eb433b4aabd85c671d |
| ENCFF180NUC.tabix.bed.gz.tbi | 325.27 KB | 4c504566d02c155521932312e3a917f2 |
| genomic_resource.yaml | 2.98 KB | 520d88e9eeb993b89356fc4cce1c7d52 |
| statistics/ |