Resource
| Id | Histone_ChIP-seq/ENCSR507UDH |
|---|---|
| Type | position_score |
| Version | 0 |
| Summary | Histone_ChIP-seq ENCSR507UDH [biosample_summary="Homo sapiens hepatocyte originated from H9" and target="H3K27ac"] |
| Description |
status: released biological_replicates: Rep 1, Rep 2 summary: female embryo (5 days) output_type: replicated peaks audit_internal_action: Archived analysis {ENCAN960CUU|/analyses/ENCAN960CUU/} has in progress subobject quality standard {encode3-histone-chip|/quality-standards/encode3-histone-chip/} audit_warning: PBC1 (PCR Bottlenecking Coefficient 1, M1/M_distinct) is the ratio of the number of genomic locations where exactly one read maps uniquely (M1) to the number of genomic locations where some reads map (M_distinct). A PBC1 value in the range 0 - 0.5 is severe bottlenecking, 0.5 - 0.8 is moderate bottlenecking, 0.8 - 0.9 is mild bottlenecking, and > 0.9 is no bottlenecking. PBC1 value > 0.9 is recommended, but > 0.8 is acceptable. ENCODE processed alignments file {ENCFF891WDF|/files/ENCFF891WDF/} processed by ChIP-seq ENCODE3 GRCh38 pipeline was generated from a library with PBC1 value of 0.90. audit_warning: PBC2 (PCR Bottlenecking Coefficient 2, M1/M2) is the ratio of the number of genomic locations where exactly one read maps uniquely (M1) to the number of genomic locations where two reads map uniquely (M2). A PBC2 value in the range 0 - 1 is severe bottlenecking, 1 - 3 is moderate bottlenecking, 3 - 10 is mild bottlenecking, > 10 is no bottlenecking. PBC2 value > 10 is recommended, but > 3 is acceptable. ENCODE processed alignments file {ENCFF891WDF|/files/ENCFF891WDF/} processed by ChIP-seq ENCODE3 GRCh38 pipeline was generated from a library with PBC2 value of 9.86. |
| Labels |
|
Scores (1)
| ID | Type | Default annotation | Description | Histogram | Range | Summary |
|---|---|---|---|---|---|---|
| Histone_ChIP-seq_ENCSR507UDH | float |
Histone_ChIP-seq_ENCSR507UDH |
Histone_ChIP-seq ENCSR507UDH [biosample_summary="Homo sapiens hepatocyte originated from H9" and target="H3K27ac"]
|
 |
[1.44, 35.3] |
|
n counts base pairs; sd is the population standard deviation.
Coverage
| Chromosome | Covered positions | Covered % | Segments |
|---|---|---|---|
| all chromosomes | 138197370 | 4.30% | 125858 |
| chr1 | 13267086 | 5.33% | 11672 |
| chr1_KI270713v1_random | 1399 | 3.43% | 3 |
| chr2 | 10817795 | 4.47% | 10100 |
| chr3 | 9069114 | 4.57% | 8449 |
| chr4 | 6521345 | 3.43% | 6180 |
| chr5 | 7396019 | 4.07% | 6935 |
| chr6 | 8545565 | 5.00% | 7868 |
| chr7 | 6724241 | 4.22% | 6309 |
| chr8 | 6129001 | 4.22% | 5826 |
| chr9 | 6287815 | 4.54% | 5608 |
| chr10 | 6596071 | 4.93% | 6133 |
| chr11 | 7316092 | 5.42% | 6450 |
| chr11_KI270721v1_random | 467 | 0.47% | 1 |
| chr12 | 6901589 | 5.18% | 6144 |
| chr13 | 3271870 | 2.86% | 3197 |
| chr14 | 4772468 | 4.46% | 4101 |
| chr15 | 4433857 | 4.35% | 4037 |
| chr16 | 4480216 | 4.96% | 4100 |
| chr17 | 6340084 | 7.62% | 5252 |
| chr17_GL000205v2_random | 580 | 0.31% | 1 |
| chr18 | 3284426 | 4.09% | 2992 |
| chr19 | 4376585 | 7.47% | 3646 |
| chr20 | 3723761 | 5.78% | 3316 |
| chr21 | 1784432 | 3.82% | 1607 |
| chr22 | 2689683 | 5.29% | 2358 |
| chr22_KI270733v1_random | 498 | 0.28% | 2 |
| chrUn_GL000195v1 | 2383 | 1.30% | 7 |
| chrX | 3462928 | 2.22% | 3564 |
| 3338 contigs with no values (185615180 bp) | 0 | 0.00% | 0 |
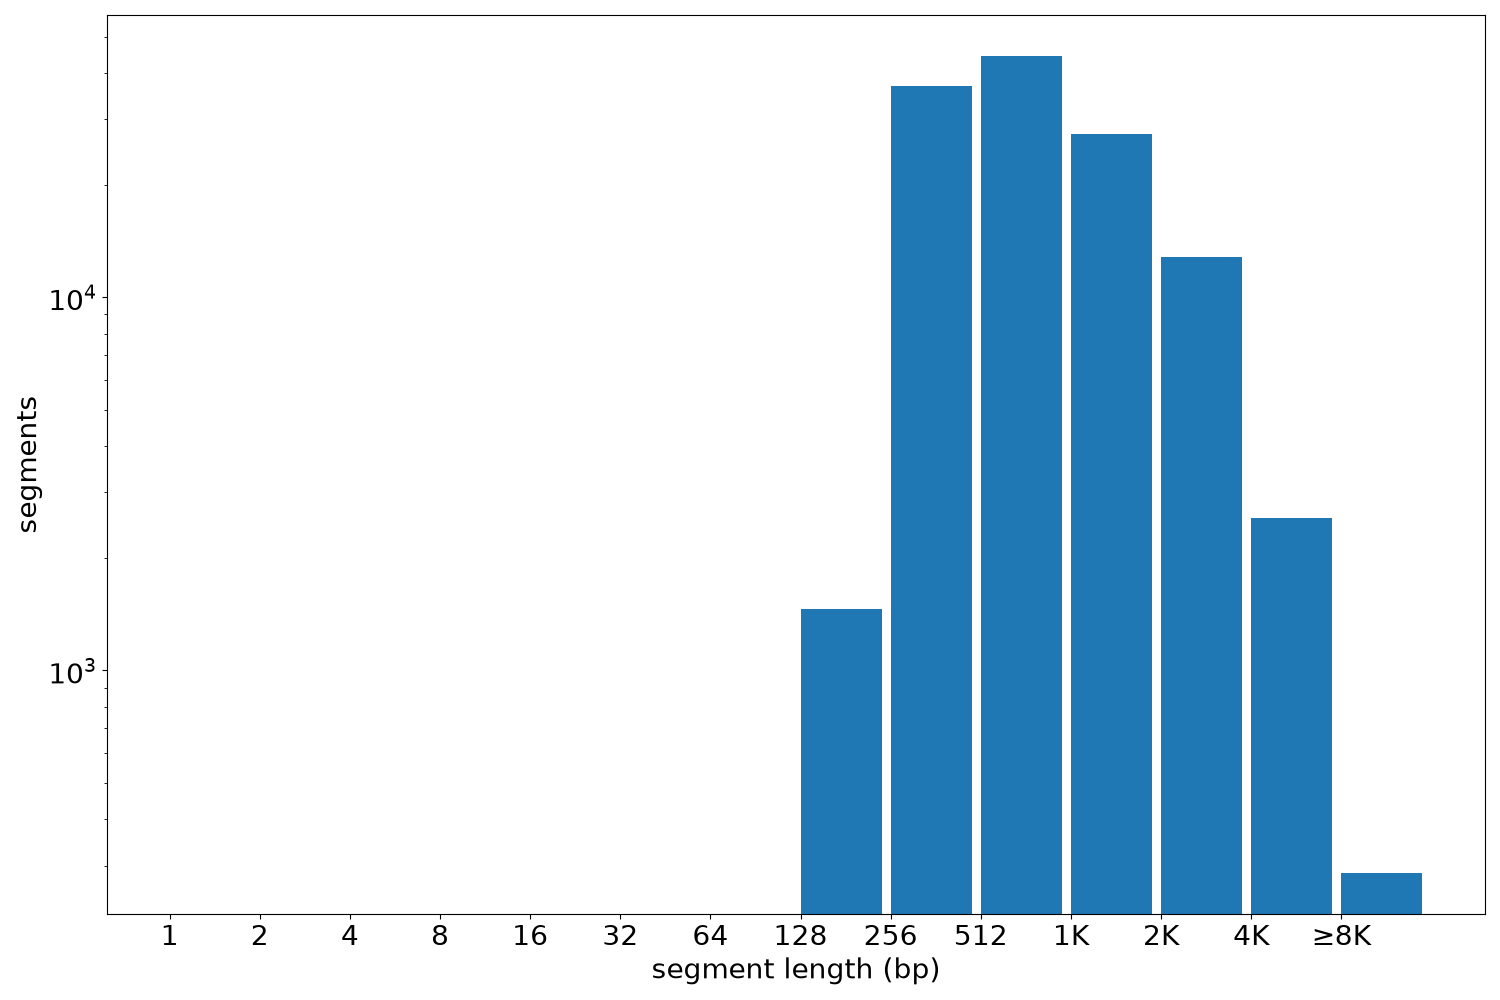
Segment lengths
| segments | min | max | mean | median | |
|---|---|---|---|---|---|
| segments | 125858 | 205 | 24463 | 1098.04 | 728 |
Files
| Filename | Size | md5 |
|---|---|---|
| ENCFF244MRN.bed.gz | 3.27 MB | ddaa0fe91fcd4ea14365a880b54e945a |
| ENCFF244MRN.tabix.bed.gz | 1.36 MB | 9e87d0c37b164c6ad031f691bcca8206 |
| ENCFF244MRN.tabix.bed.gz.tbi | 352.26 KB | 6b8966e3d997fe99cdb41e794ccc6387 |
| genomic_resource.yaml | 2.74 KB | 4201a9c4a61d668b276e4a7bfbda42d6 |
| statistics/ |