Resource
| Id | Histone_ChIP-seq/ENCSR442ZOI |
|---|---|
| Type | position_score |
| Version | 0 |
| Summary | Histone_ChIP-seq ENCSR442ZOI [biosample_summary="Homo sapiens hepatocyte originated from H9" and target="H3K4me3"] |
| Description |
status: released biological_replicates: Rep 1, Rep 2 summary: female embryo (5 days) output_type: replicated peaks audit_internal_action: Archived analysis {ENCAN858FLA|/analyses/ENCAN858FLA/} has in progress subobject quality standard {encode3-histone-chip|/quality-standards/encode3-histone-chip/} audit_warning: PBC1 (PCR Bottlenecking Coefficient 1, M1/M_distinct) is the ratio of the number of genomic locations where exactly one read maps uniquely (M1) to the number of genomic locations where some reads map (M_distinct). A PBC1 value in the range 0 - 0.5 is severe bottlenecking, 0.5 - 0.8 is moderate bottlenecking, 0.8 - 0.9 is mild bottlenecking, and > 0.9 is no bottlenecking. PBC1 value > 0.9 is recommended, but > 0.8 is acceptable. ENCODE processed alignments file {ENCFF434GEP|/files/ENCFF434GEP/} processed by ChIP-seq ENCODE3 hg19 pipeline was generated from a library with PBC1 value of 0.87. audit_warning: PBC2 (PCR Bottlenecking Coefficient 2, M1/M2) is the ratio of the number of genomic locations where exactly one read maps uniquely (M1) to the number of genomic locations where two reads map uniquely (M2). A PBC2 value in the range 0 - 1 is severe bottlenecking, 1 - 3 is moderate bottlenecking, 3 - 10 is mild bottlenecking, > 10 is no bottlenecking. PBC2 value > 10 is recommended, but > 3 is acceptable. ENCODE processed alignments file {ENCFF434GEP|/files/ENCFF434GEP/} processed by ChIP-seq ENCODE3 hg19 pipeline was generated from a library with PBC2 value of 7.28. |
| Labels |
|
Scores (1)
| ID | Type | Default annotation | Description | Histogram | Range | Summary |
|---|---|---|---|---|---|---|
| Histone_ChIP-seq_ENCSR442ZOI | float |
Histone_ChIP-seq_ENCSR442ZOI |
Histone_ChIP-seq ENCSR442ZOI [biosample_summary="Homo sapiens hepatocyte originated from H9" and target="H3K4me3"]
|
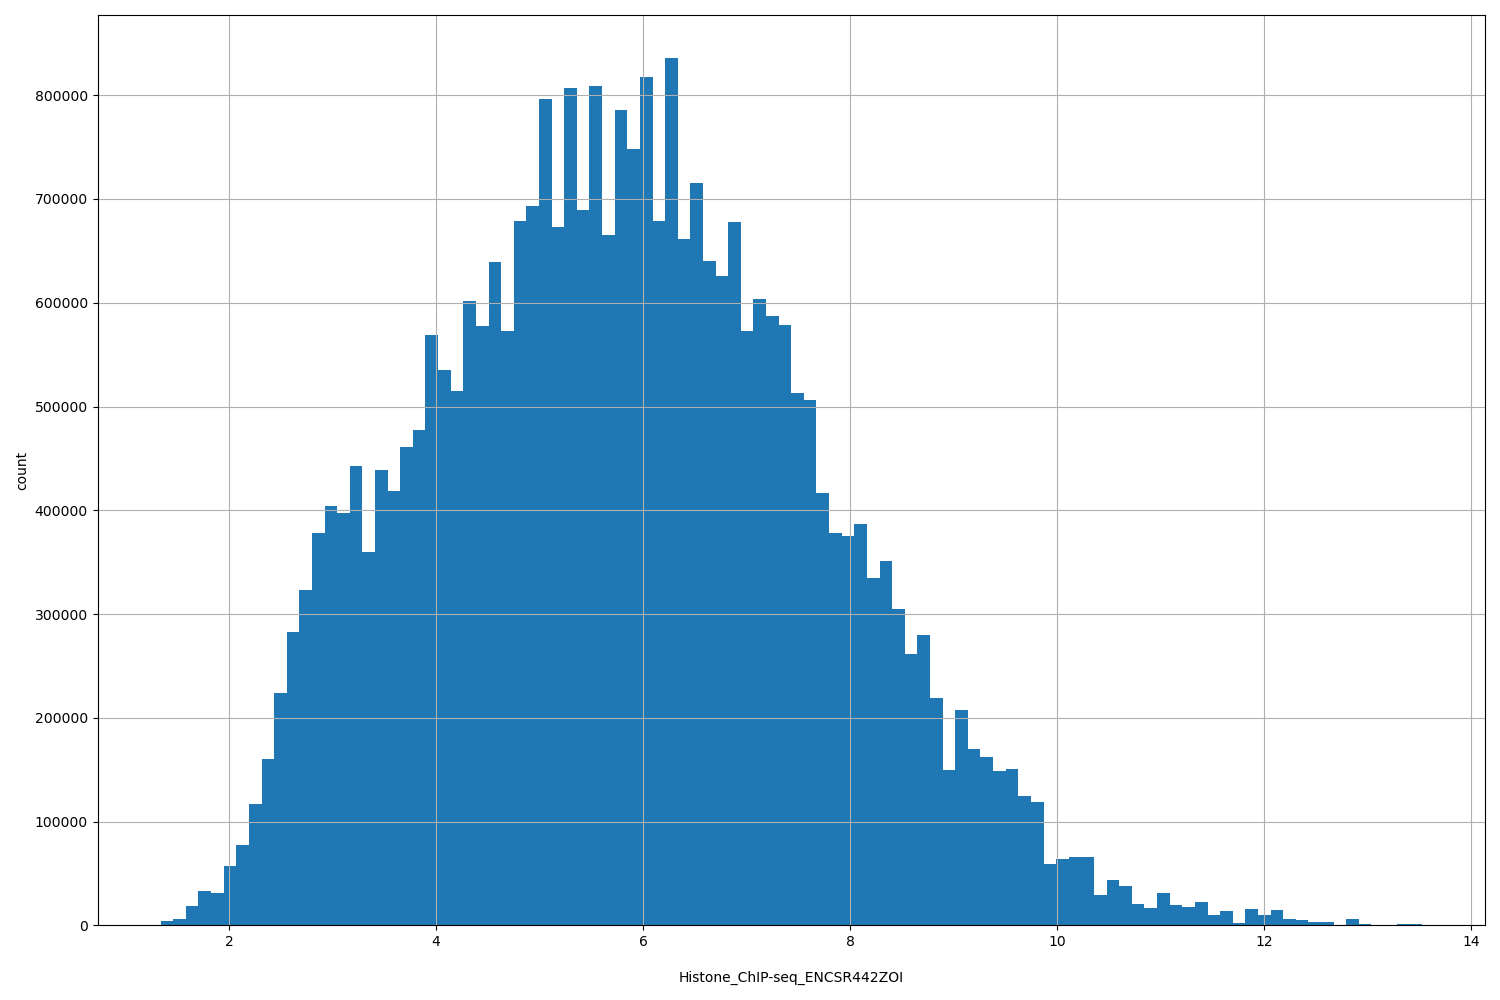 |
[1.34, 13.5] |
|
n counts base pairs; sd is the population standard deviation.
Coverage
| Chromosome | Covered positions | Covered % | Segments |
|---|---|---|---|
| all chromosomes | 30613731 | 0.95% | 28025 |
| chr1 | 2951558 | 1.19% | 2689 |
| chr2 | 2179566 | 0.90% | 1928 |
| chr3 | 1780454 | 0.90% | 1541 |
| chr4 | 1463073 | 0.77% | 1226 |
| chr5 | 1572133 | 0.87% | 1340 |
| chr6 | 1952373 | 1.14% | 1689 |
| chr7 | 1497283 | 0.94% | 1388 |
| chr8 | 1172860 | 0.81% | 1016 |
| chr9 | 1228665 | 0.89% | 1112 |
| chr10 | 1282953 | 0.96% | 1127 |
| chr11 | 1587488 | 1.18% | 1459 |
| chr12 | 1650718 | 1.24% | 1465 |
| chr13 | 679404 | 0.59% | 580 |
| chr14 | 1020611 | 0.95% | 909 |
| chr15 | 983809 | 0.96% | 895 |
| chr16 | 1097560 | 1.21% | 1089 |
| chr17 | 1628671 | 1.96% | 1554 |
| chr18 | 561759 | 0.70% | 491 |
| chr19 | 1766743 | 3.01% | 1955 |
| chr20 | 745776 | 1.16% | 684 |
| chr21 | 316885 | 0.68% | 309 |
| chr22 | 569011 | 1.12% | 600 |
| chrM | 11691 | 70.56% | 8 |
| chrX | 911190 | 0.58% | 969 |
| chrY | 1497 | <0.01% | 2 |
| 3341 contigs with no values (129060516 bp) | 0 | 0.00% | 0 |
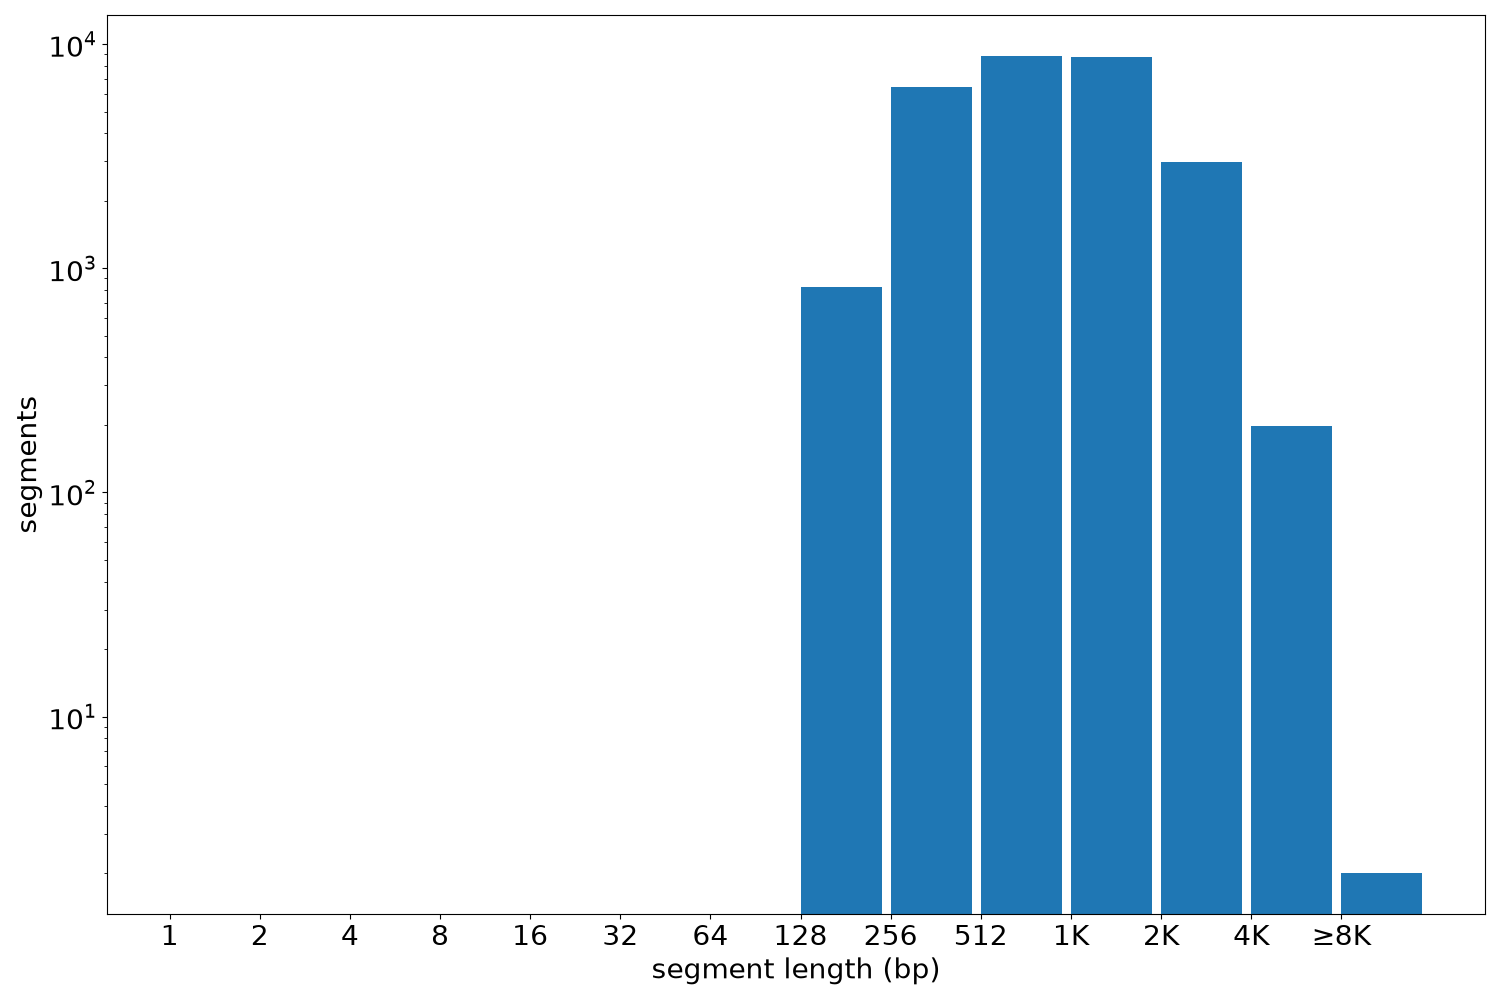
Segment lengths
| segments | min | max | mean | median | |
|---|---|---|---|---|---|
| segments | 28025 | 185 | 8814 | 1092.37 | 882 |
Files
| Filename | Size | md5 |
|---|---|---|
| ENCFF969SEE.bed.gz | 748.66 KB | 3e665af7d2b06ee2ac24b9f0e78c3151 |
| ENCFF969SEE.tabix.bed.gz | 316.47 KB | 2879bf3296427742abd267290af99799 |
| ENCFF969SEE.tabix.bed.gz.tbi | 146.17 KB | a98b73436a158c98efdccd8f68b9845f |
| genomic_resource.yaml | 2.73 KB | 46eff377bcac587ef6e7d3257351bbd4 |
| statistics/ |