Resource
| Id | Histone_ChIP-seq/ENCSR439EHQ |
|---|---|
| Type | position_score |
| Version | 0 |
| Summary | Histone_ChIP-seq ENCSR439EHQ [biosample_summary="Homo sapiens mesenchymal stem cell female adult and female adult (41 years) and female adult (59 years), originated from adipose tissue" and target="H3K9me3"] |
| Description |
status: released biological_replicates: Rep 1, Rep 2 summary: female adult (41 years) female adult female adult (59 years) output_type: pseudoreplicated peaks audit_internal_action: Released analysis {ENCAN180ZAE|/analyses/ENCAN180ZAE/} has in progress subobject quality standard {encode4-histone-chip|/quality-standards/encode4-histone-chip/} audit_warning: PBC1 (PCR Bottlenecking Coefficient 1, M1/M_distinct) is the ratio of the number of genomic locations where exactly one read maps uniquely (M1) to the number of genomic locations where some reads map (M_distinct). A PBC1 value in the range 0 - 0.5 is severe bottlenecking, 0.5 - 0.8 is moderate bottlenecking, 0.8 - 0.9 is mild bottlenecking, and > 0.9 is no bottlenecking. PBC1 value > 0.9 is recommended, but > 0.8 is acceptable. ENCODE processed redacted alignments file {ENCFF236VQB|/files/ENCFF236VQB/} processed by ChIP-seq ENCODE4 v1.7.0 GRCh38 pipeline was generated from a library with PBC1 value of 0.86. audit_warning: PBC2 (PCR Bottlenecking Coefficient 2, M1/M2) is the ratio of the number of genomic locations where exactly one read maps uniquely (M1) to the number of genomic locations where two reads map uniquely (M2). A PBC2 value in the range 0 - 1 is severe bottlenecking, 1 - 3 is moderate bottlenecking, 3 - 10 is mild bottlenecking, > 10 is no bottlenecking. PBC2 value > 10 is recommended, but > 3 is acceptable. ENCODE processed redacted alignments file {ENCFF236VQB|/files/ENCFF236VQB/} processed by ChIP-seq ENCODE4 v1.7.0 GRCh38 pipeline was generated from a library with PBC2 value of 7.26. audit_warning: PBC1 (PCR Bottlenecking Coefficient 1, M1/M_distinct) is the ratio of the number of genomic locations where exactly one read maps uniquely (M1) to the number of genomic locations where some reads map (M_distinct). A PBC1 value in the range 0 - 0.5 is severe bottlenecking, 0.5 - 0.8 is moderate bottlenecking, 0.8 - 0.9 is mild bottlenecking, and > 0.9 is no bottlenecking. PBC1 value > 0.9 is recommended, but > 0.8 is acceptable. ENCODE processed redacted alignments file {ENCFF966QTO|/files/ENCFF966QTO/} processed by ChIP-seq ENCODE4 v1.7.0 GRCh38 pipeline was generated from a library with PBC1 value of 0.86. audit_warning: PBC2 (PCR Bottlenecking Coefficient 2, M1/M2) is the ratio of the number of genomic locations where exactly one read maps uniquely (M1) to the number of genomic locations where two reads map uniquely (M2). A PBC2 value in the range 0 - 1 is severe bottlenecking, 1 - 3 is moderate bottlenecking, 3 - 10 is mild bottlenecking, > 10 is no bottlenecking. PBC2 value > 10 is recommended, but > 3 is acceptable. ENCODE processed redacted alignments file {ENCFF966QTO|/files/ENCFF966QTO/} processed by ChIP-seq ENCODE4 v1.7.0 GRCh38 pipeline was generated from a library with PBC2 value of 7.36. |
| Labels |
|
Scores (1)
| ID | Type | Default annotation | Description | Histogram | Range | Summary |
|---|---|---|---|---|---|---|
| Histone_ChIP-seq_ENCSR439EHQ | float |
Histone_ChIP-seq_ENCSR439EHQ |
Histone_ChIP-seq ENCSR439EHQ [biosample_summary="Homo sapiens mesenchymal stem cell female adult and female adult (41 years) and female adult (59 years), originated from adipose tissue" and target="H3K9me3"]
|
 |
[1.7, 21.1] |
|
n counts base pairs; sd is the population standard deviation.
Coverage
| Chromosome | Covered positions | Covered % | Segments |
|---|---|---|---|
| all chromosomes | 96093179 | 2.99% | 141687 |
| chr1 | 6075181 | 2.44% | 8859 |
| chr2 | 7796345 | 3.22% | 12103 |
| chr3 | 5957061 | 3.00% | 9286 |
| chr4 | 6374065 | 3.35% | 10046 |
| chr5 | 6333615 | 3.49% | 9471 |
| chr6 | 4738400 | 2.77% | 7338 |
| chr7 | 6043745 | 3.79% | 9116 |
| chr8 | 5049327 | 3.48% | 7647 |
| chr9 | 3571575 | 2.58% | 5126 |
| chr10 | 4103444 | 3.07% | 5986 |
| chr11 | 3963394 | 2.93% | 5890 |
| chr12 | 4467132 | 3.35% | 6265 |
| chr13 | 3270060 | 2.86% | 5366 |
| chr14 | 2604584 | 2.43% | 4041 |
| chr15 | 2544981 | 2.50% | 3659 |
| chr16 | 2395850 | 2.65% | 3390 |
| chr17 | 1679051 | 2.02% | 2380 |
| chr18 | 2283142 | 2.84% | 3539 |
| chr19 | 7478294 | 12.76% | 6948 |
| chr20 | 1510877 | 2.34% | 2277 |
| chr21 | 1274786 | 2.73% | 1940 |
| chr22 | 778549 | 1.53% | 1189 |
| chrX | 5796323 | 3.71% | 9814 |
| chrY | 3398 | 0.01% | 11 |
| 3342 contigs with no values (129077085 bp) | 0 | 0.00% | 0 |
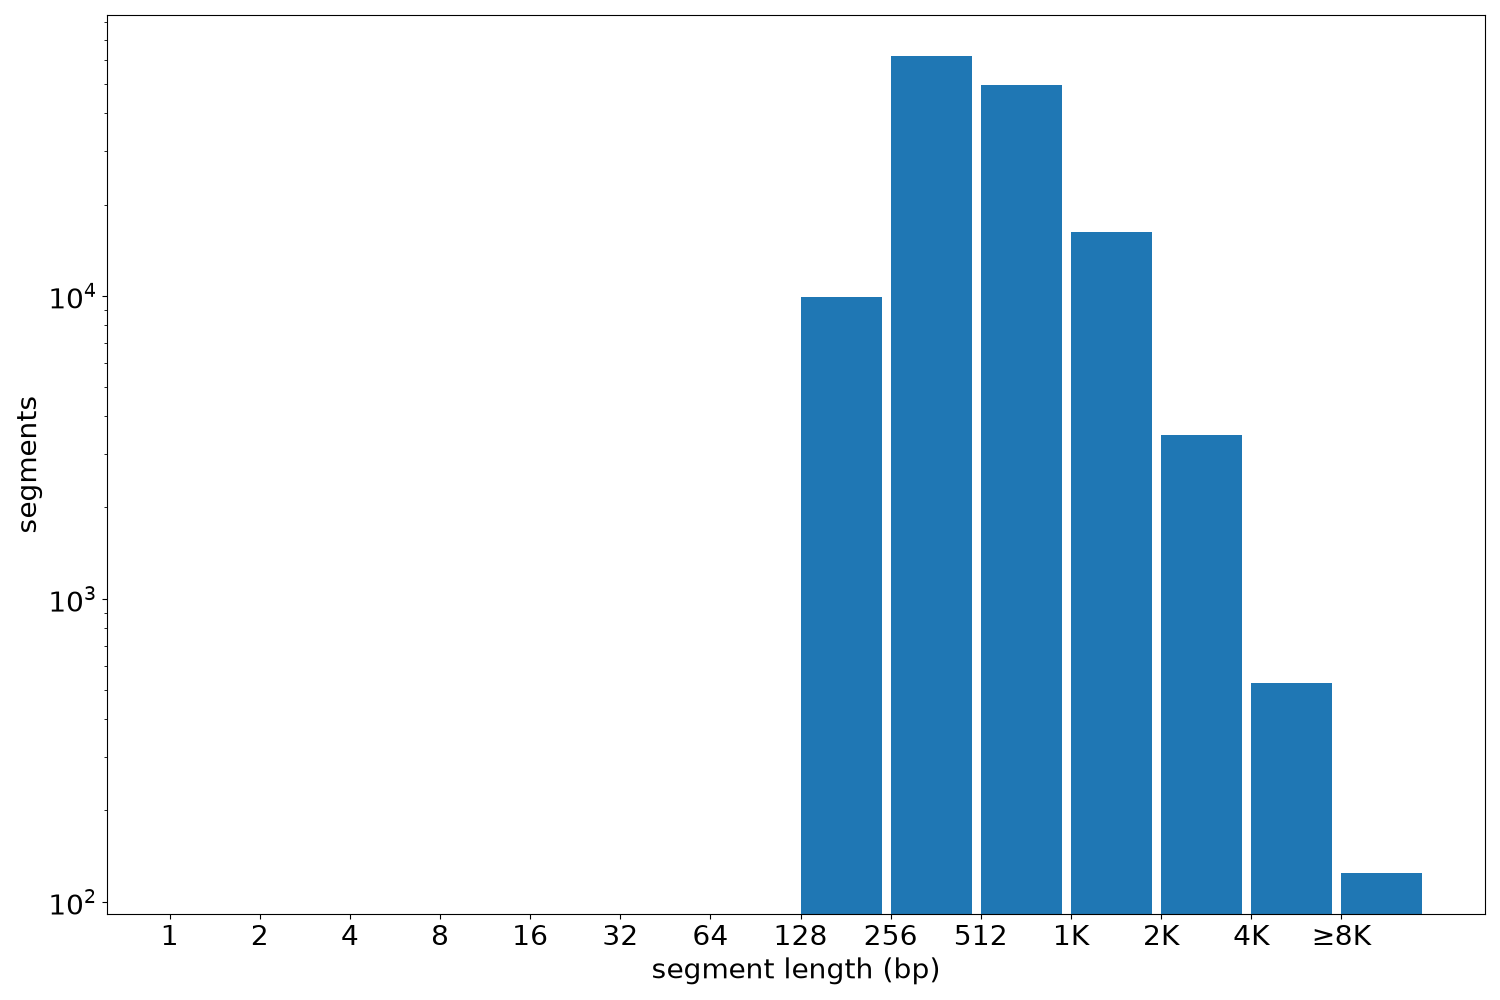
Segment lengths
| segments | min | max | mean | median | |
|---|---|---|---|---|---|
| segments | 141687 | 175 | 38726 | 678.21 | 507 |
Files
| Filename | Size | md5 |
|---|---|---|
| ENCFF593DYT.bed.gz | 2.65 MB | 4970b38b890a91fe9efa6368300c628a |
| ENCFF593DYT.tabix.bed.gz | 1.34 MB | 6c35fff9a29cf3d55ed412712ca2f1f4 |
| ENCFF593DYT.tabix.bed.gz.tbi | 385.02 KB | eebd79277fc6083ba3430b5a843f8078 |
| genomic_resource.yaml | 4.53 KB | 5962cff7e7bd0d4a1b3f3f8b8b67d822 |
| statistics/ |