Resource
| Id | Histone_ChIP-seq/ENCSR427RFW |
|---|---|
| Type | position_score |
| Version | 0 |
| Summary | Histone_ChIP-seq ENCSR427RFW [biosample_summary="Homo sapiens trophoblast cell originated from H1" and target="H2AK5ac"] |
| Description |
status: released biological_replicates: Rep 1, Rep 2 summary: male embryo output_type: pseudoreplicated peaks audit_internal_action: Released analysis {ENCAN096FWJ|/analyses/ENCAN096FWJ/} has in progress subobject quality standard {encode4-histone-chip|/quality-standards/encode4-histone-chip/} audit_internal_action: Released analysis {ENCAN096FWJ|/analyses/ENCAN096FWJ/} has in progress subobject document {0d446c82-018d-4d04-9234-fbfb83a3a279|/documents/0d446c82-018d-4d04-9234-fbfb83a3a279/} audit_warning: PBC1 (PCR Bottlenecking Coefficient 1, M1/M_distinct) is the ratio of the number of genomic locations where exactly one read maps uniquely (M1) to the number of genomic locations where some reads map (M_distinct). A PBC1 value in the range 0 - 0.5 is severe bottlenecking, 0.5 - 0.8 is moderate bottlenecking, 0.8 - 0.9 is mild bottlenecking, and > 0.9 is no bottlenecking. PBC1 value > 0.9 is recommended, but > 0.8 is acceptable. ENCODE processed alignments file {ENCFF356CJH|/files/ENCFF356CJH/} processed by ChIP-seq ENCODE4 v1.6.1 GRCh38 pipeline was generated from a library with PBC1 value of 0.87. audit_warning: PBC2 (PCR Bottlenecking Coefficient 2, M1/M2) is the ratio of the number of genomic locations where exactly one read maps uniquely (M1) to the number of genomic locations where two reads map uniquely (M2). A PBC2 value in the range 0 - 1 is severe bottlenecking, 1 - 3 is moderate bottlenecking, 3 - 10 is mild bottlenecking, > 10 is no bottlenecking. PBC2 value > 10 is recommended, but > 3 is acceptable. ENCODE processed alignments file {ENCFF356CJH|/files/ENCFF356CJH/} processed by ChIP-seq ENCODE4 v1.6.1 GRCh38 pipeline was generated from a library with PBC2 value of 8.55. |
| Labels |
|
Scores (1)
| ID | Type | Default annotation | Description | Histogram | Range | Summary |
|---|---|---|---|---|---|---|
| Histone_ChIP-seq_ENCSR427RFW | float |
Histone_ChIP-seq_ENCSR427RFW |
Histone_ChIP-seq ENCSR427RFW [biosample_summary="Homo sapiens trophoblast cell originated from H1" and target="H2AK5ac"]
|
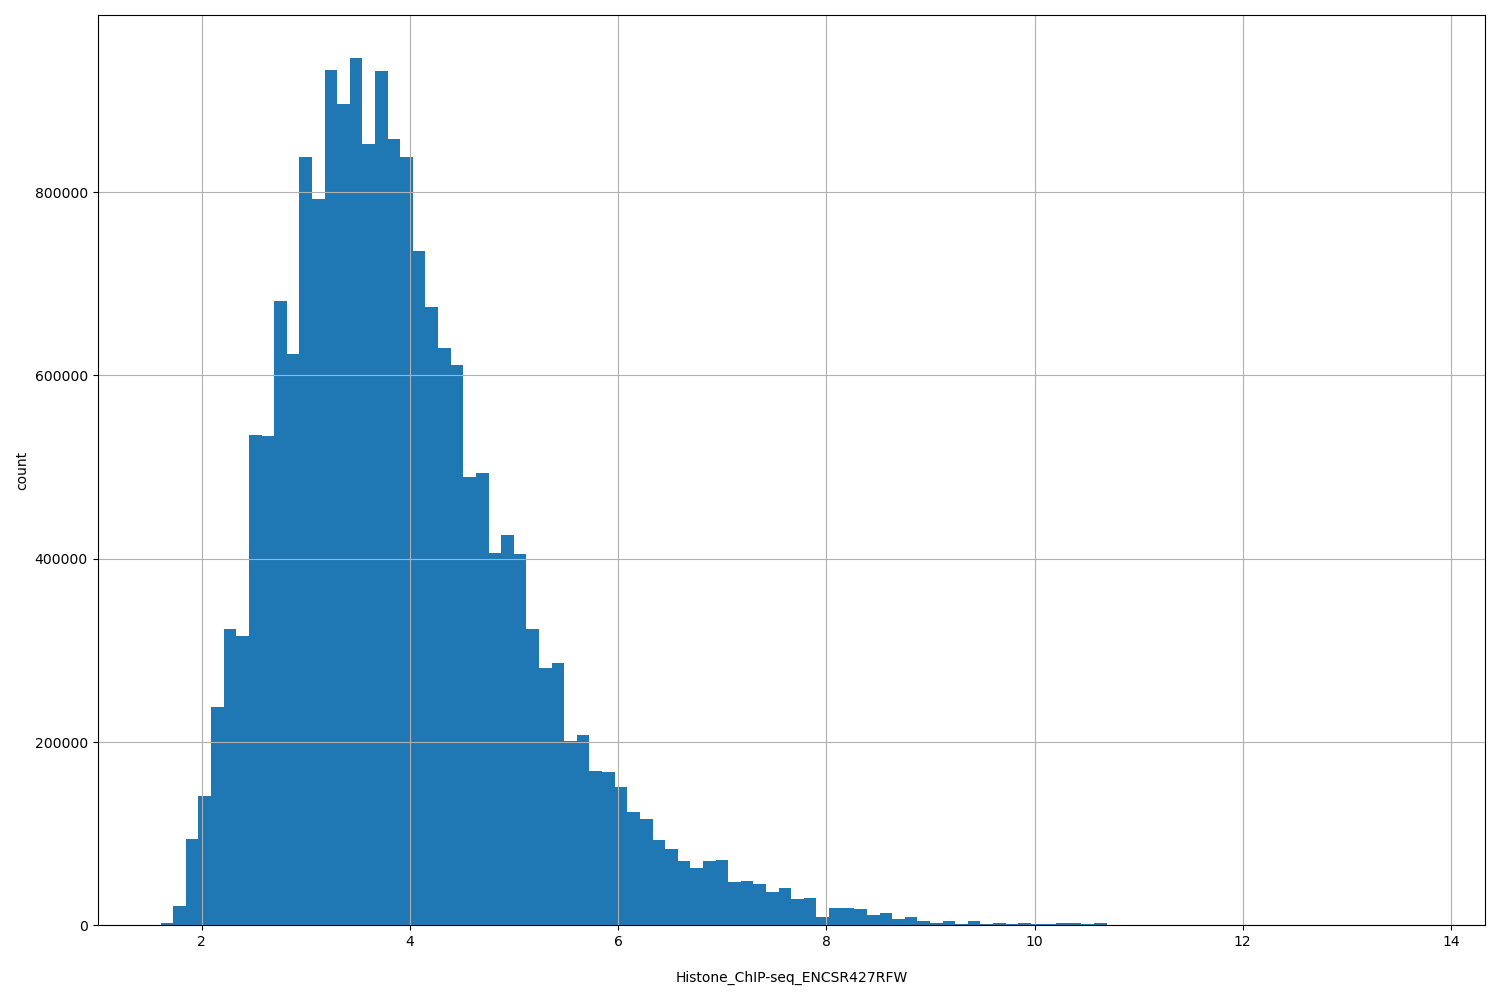 |
[1.61, 13.7] |
|
n counts base pairs; sd is the population standard deviation.
Coverage
| Chromosome | Covered positions | Covered % | Segments |
|---|---|---|---|
| all chromosomes | 19169266 | 0.60% | 66148 |
| chr1 | 2173984 | 0.87% | 7406 |
| chr2 | 1502762 | 0.62% | 5336 |
| chr3 | 1024122 | 0.52% | 3770 |
| chr4 | 562550 | 0.30% | 2183 |
| chr5 | 966215 | 0.53% | 3410 |
| chr6 | 856985 | 0.50% | 3228 |
| chr7 | 803133 | 0.50% | 2878 |
| chr8 | 861070 | 0.59% | 3081 |
| chr9 | 979805 | 0.71% | 3236 |
| chr10 | 1057527 | 0.79% | 3642 |
| chr11 | 1104401 | 0.82% | 3673 |
| chr12 | 903144 | 0.68% | 3145 |
| chr13 | 420572 | 0.37% | 1603 |
| chr14 | 680965 | 0.64% | 2305 |
| chr15 | 645840 | 0.63% | 2193 |
| chr16 | 746673 | 0.83% | 2433 |
| chr17 | 1079502 | 1.30% | 3441 |
| chr18 | 330934 | 0.41% | 1246 |
| chr19 | 870994 | 1.49% | 2652 |
| chr20 | 616708 | 0.96% | 2025 |
| chr21 | 210001 | 0.45% | 690 |
| chr22 | 549218 | 1.08% | 1720 |
| chrX | 213804 | 0.14% | 818 |
| chrY | 8357 | 0.01% | 34 |
| 3342 contigs with no values (129077085 bp) | 0 | 0.00% | 0 |
Segment lengths
| segments | min | max | mean | median | |
|---|---|---|---|---|---|
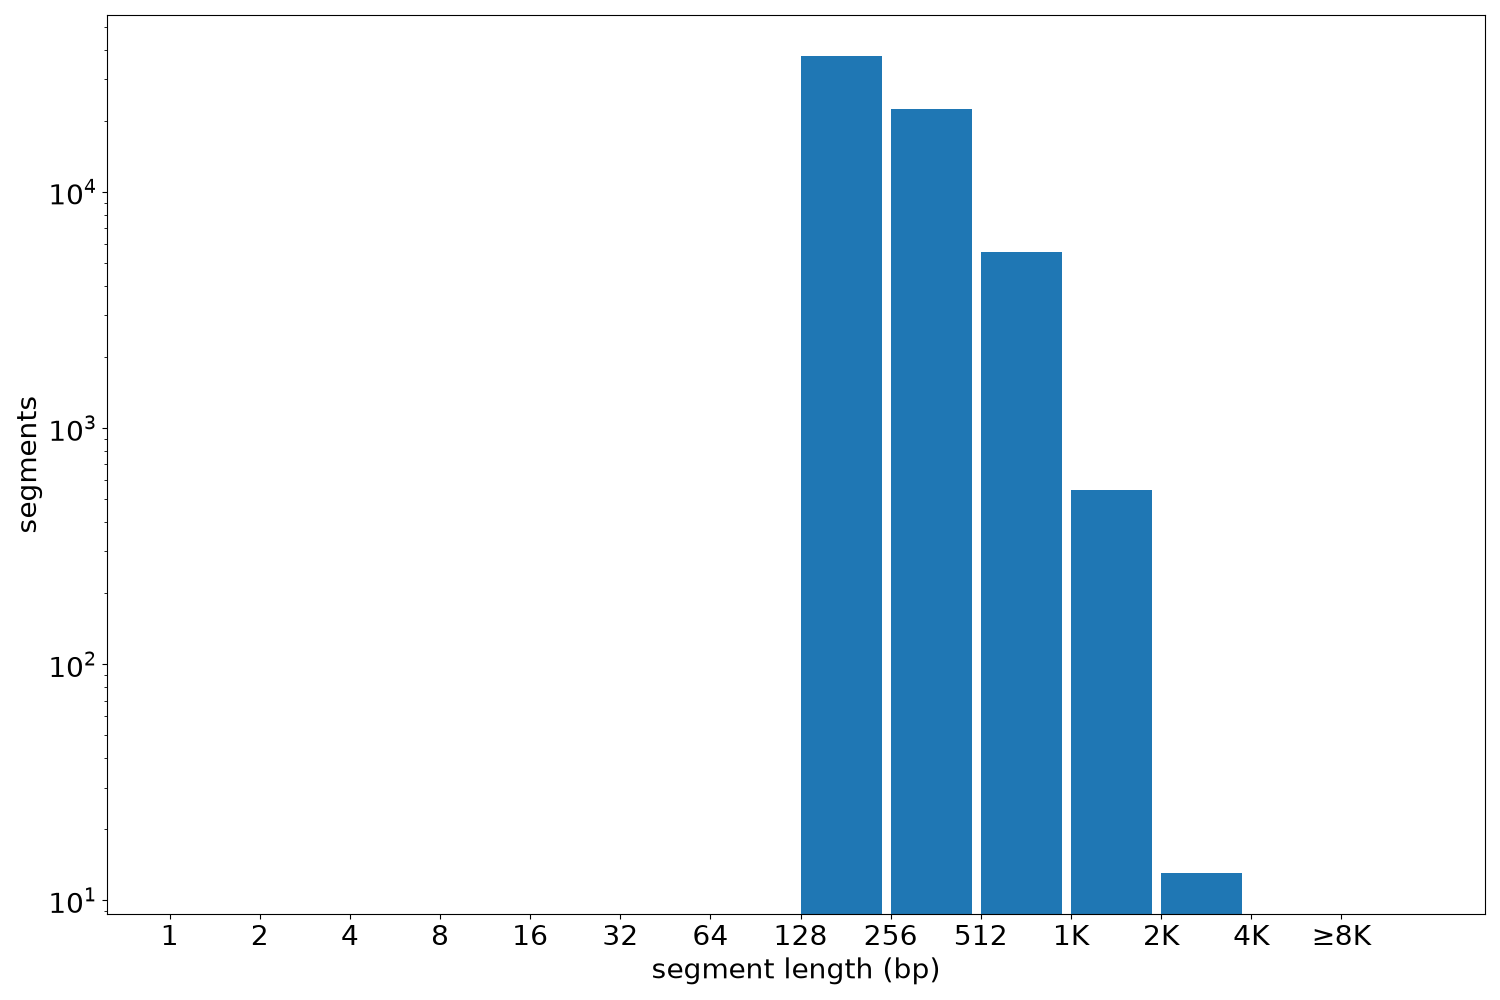
| segments | 66148 | 133 | 3171 | 289.79 | 234 |
Files
| Filename | Size | md5 |
|---|---|---|
| ENCFF106GQV.bed.gz | 1.35 MB | 392e4945905e301a8ef2a13777dfb4f8 |
| ENCFF106GQV.tabix.bed.gz | 670.63 KB | 623acd4df35792a9153e0cc959ff4919 |
| ENCFF106GQV.tabix.bed.gz.tbi | 201.16 KB | 16b375a85e299b79eec76b4b5da473f3 |
| genomic_resource.yaml | 2.96 KB | 817a2b58329082906f12bf6198ef1aaf |
| statistics/ |