Resource
| Id | Histone_ChIP-seq/ENCSR389WWC |
|---|---|
| Type | position_score |
| Version | 0 |
| Summary | Histone_ChIP-seq ENCSR389WWC [biosample_summary="Homo sapiens OCI-LY7" and target="H3K9me3"] |
| Description |
status: released biological_replicates: Rep 1, Rep 2 summary: output_type: pseudoreplicated peaks audit_internal_action: Released analysis {ENCAN838WBN|/analyses/ENCAN838WBN/} has in progress subobject quality standard {encode4-histone-chip|/quality-standards/encode4-histone-chip/} audit_internal_action: Released analysis {ENCAN838WBN|/analyses/ENCAN838WBN/} has in progress subobject document {efd5304b-2022-41f0-a9ec-a7b20fda86c9|/documents/efd5304b-2022-41f0-a9ec-a7b20fda86c9/} audit_warning: PBC1 (PCR Bottlenecking Coefficient 1, M1/M_distinct) is the ratio of the number of genomic locations where exactly one read maps uniquely (M1) to the number of genomic locations where some reads map (M_distinct). A PBC1 value in the range 0 - 0.5 is severe bottlenecking, 0.5 - 0.8 is moderate bottlenecking, 0.8 - 0.9 is mild bottlenecking, and > 0.9 is no bottlenecking. PBC1 value > 0.9 is recommended, but > 0.8 is acceptable. ENCODE processed alignments file {ENCFF586OBE|/files/ENCFF586OBE/} processed by ChIP-seq ENCODE4 v1.6.1 GRCh38 pipeline was generated from a library with PBC1 value of 0.90. audit_warning: PBC2 (PCR Bottlenecking Coefficient 2, M1/M2) is the ratio of the number of genomic locations where exactly one read maps uniquely (M1) to the number of genomic locations where two reads map uniquely (M2). A PBC2 value in the range 0 - 1 is severe bottlenecking, 1 - 3 is moderate bottlenecking, 3 - 10 is mild bottlenecking, > 10 is no bottlenecking. PBC2 value > 10 is recommended, but > 3 is acceptable. ENCODE processed alignments file {ENCFF586OBE|/files/ENCFF586OBE/} processed by ChIP-seq ENCODE4 v1.6.1 GRCh38 pipeline was generated from a library with PBC2 value of 9.43. |
| Labels |
|
Scores (1)
| ID | Type | Default annotation | Description | Histogram | Range | Summary |
|---|---|---|---|---|---|---|
| Histone_ChIP-seq_ENCSR389WWC | float |
Histone_ChIP-seq_ENCSR389WWC |
Histone_ChIP-seq ENCSR389WWC [biosample_summary="Homo sapiens OCI-LY7" and target="H3K9me3"]
|
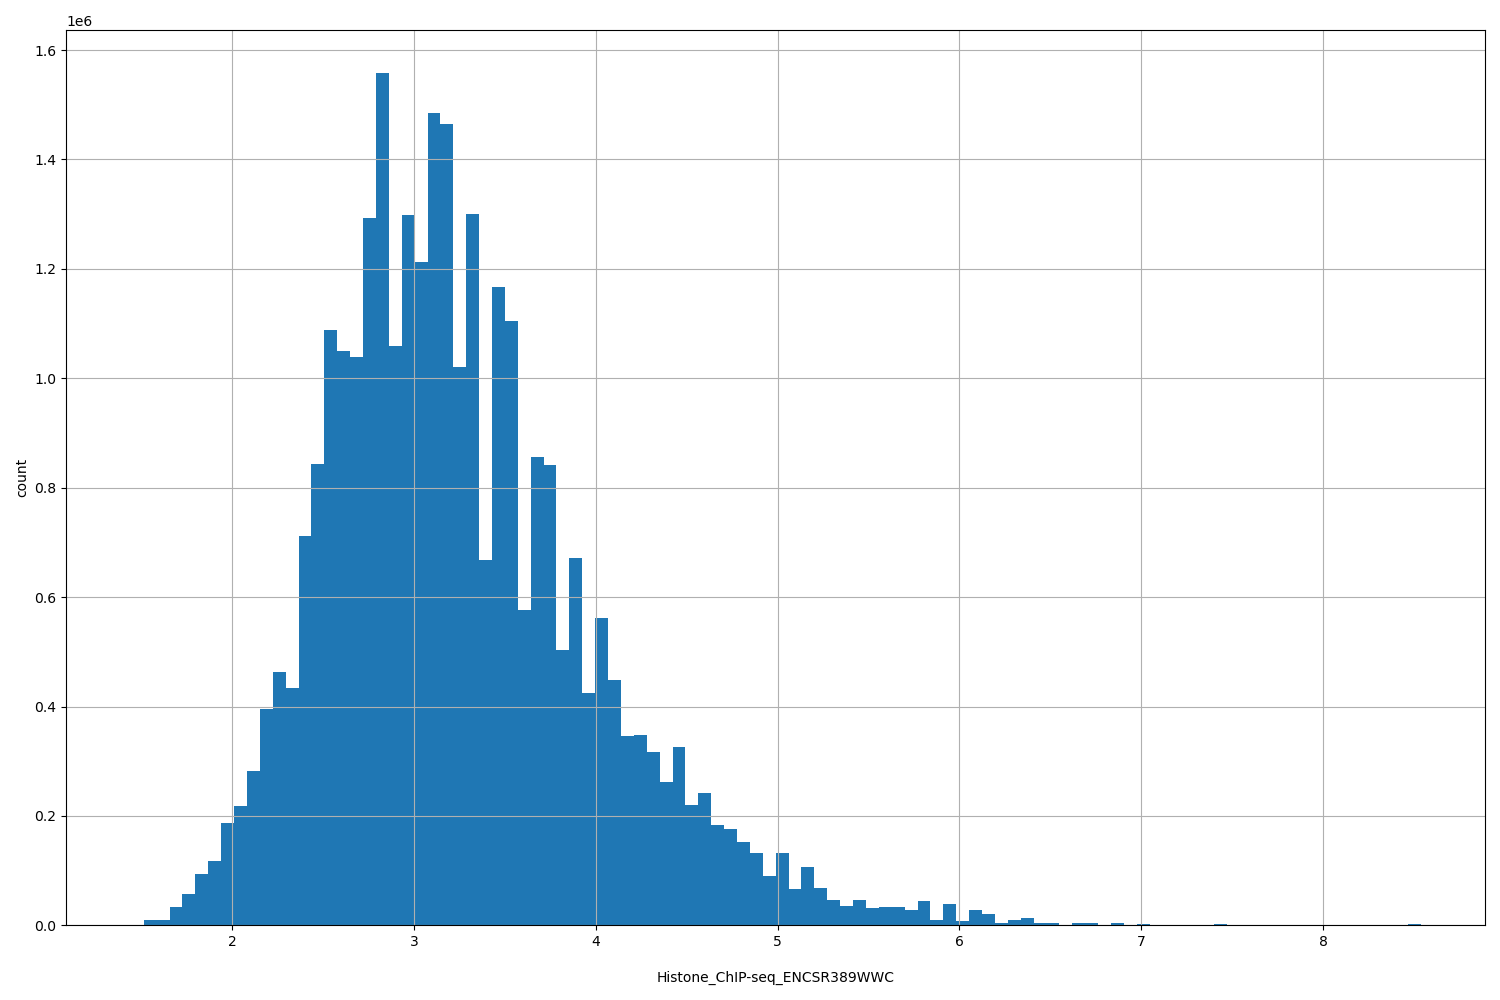 |
[1.44, 8.54] |
|
n counts base pairs; sd is the population standard deviation.
Coverage
| Chromosome | Covered positions | Covered % | Segments |
|---|---|---|---|
| all chromosomes | 30181558 | 0.94% | 35335 |
| chr1 | 2174969 | 0.87% | 2456 |
| chr2 | 2386197 | 0.99% | 2664 |
| chr3 | 1871086 | 0.94% | 2187 |
| chr4 | 1957286 | 1.03% | 2278 |
| chr5 | 1531013 | 0.84% | 1935 |
| chr6 | 1620073 | 0.95% | 1862 |
| chr7 | 1593079 | 1.00% | 1842 |
| chr8 | 1353433 | 0.93% | 1556 |
| chr9 | 952975 | 0.69% | 1065 |
| chr10 | 1076862 | 0.80% | 1245 |
| chr11 | 1219439 | 0.90% | 1501 |
| chr12 | 1916597 | 1.44% | 2090 |
| chr13 | 1329326 | 1.16% | 1678 |
| chr14 | 1335275 | 1.25% | 1693 |
| chr15 | 757322 | 0.74% | 884 |
| chr16 | 869509 | 0.96% | 972 |
| chr17 | 822638 | 0.99% | 942 |
| chr18 | 374950 | 0.47% | 422 |
| chr19 | 1925286 | 3.28% | 2068 |
| chr20 | 528810 | 0.82% | 616 |
| chr21 | 1813404 | 3.88% | 2491 |
| chr22 | 506995 | 1.00% | 576 |
| chrX | 219326 | 0.14% | 268 |
| chrY | 45708 | 0.08% | 44 |
| 3342 contigs with no values (129077085 bp) | 0 | 0.00% | 0 |
Segment lengths
| segments | min | max | mean | median | |
|---|---|---|---|---|---|
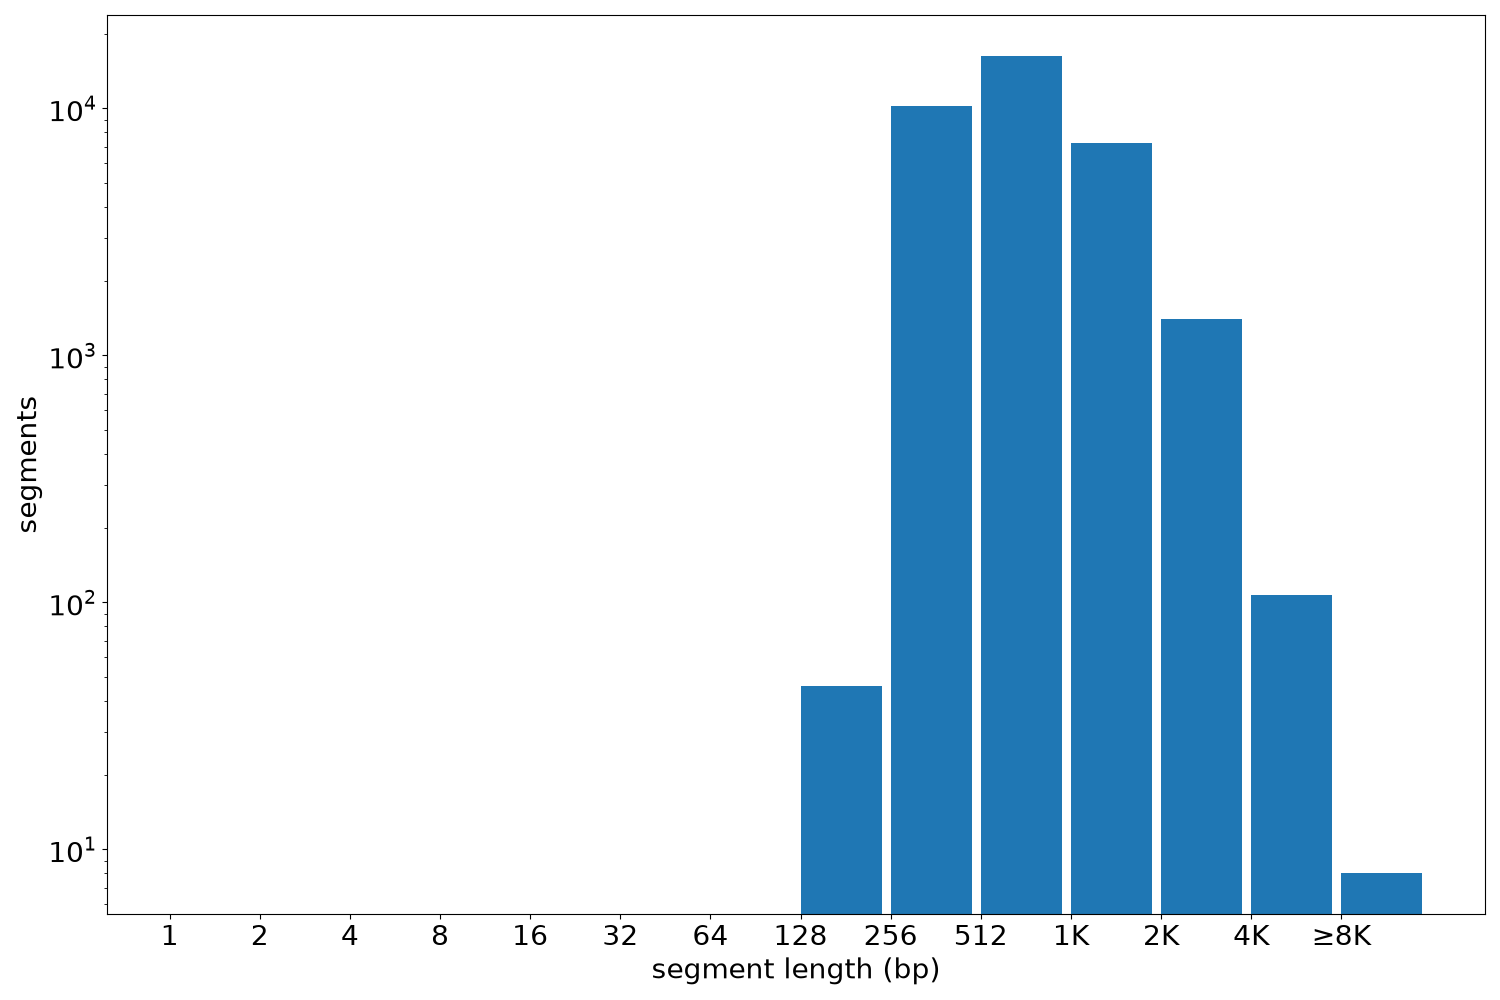
| segments | 35335 | 233 | 11834 | 854.15 | 679 |
Files
| Filename | Size | md5 |
|---|---|---|
| ENCFF429HZL.bed.gz | 800.28 KB | 76ad3dade9f0a7446f5e1b1b2d40d3aa |
| ENCFF429HZL.tabix.bed.gz | 374.72 KB | d4b685849a945b242eb8a726be9cbc38 |
| ENCFF429HZL.tabix.bed.gz.tbi | 163.89 KB | 49a0f7a835b20ccfd171a9e62ce26b1e |
| genomic_resource.yaml | 2.91 KB | 14e2cbea30e2a80b1f644699e87120a6 |
| statistics/ |