Resource
| Id | Histone_ChIP-seq/ENCSR350RYG |
|---|---|
| Type | position_score |
| Version | 0 |
| Summary | Histone_ChIP-seq ENCSR350RYG [biosample_summary="Homo sapiens DOHH2" and target="H3K27me3"] |
| Description |
status: released biological_replicates: Rep 1, Rep 2 summary: output_type: pseudoreplicated peaks audit_internal_action: Released analysis {ENCAN646WSY|/analyses/ENCAN646WSY/} has in progress subobject quality standard {encode4-histone-chip|/quality-standards/encode4-histone-chip/} audit_internal_action: Released analysis {ENCAN646WSY|/analyses/ENCAN646WSY/} has in progress subobject document {5b4d26ea-963d-4140-8af1-4bb622f57387|/documents/5b4d26ea-963d-4140-8af1-4bb622f57387/} audit_warning: PBC1 (PCR Bottlenecking Coefficient 1, M1/M_distinct) is the ratio of the number of genomic locations where exactly one read maps uniquely (M1) to the number of genomic locations where some reads map (M_distinct). A PBC1 value in the range 0 - 0.5 is severe bottlenecking, 0.5 - 0.8 is moderate bottlenecking, 0.8 - 0.9 is mild bottlenecking, and > 0.9 is no bottlenecking. PBC1 value > 0.9 is recommended, but > 0.8 is acceptable. ENCODE processed alignments file {ENCFF578YVW|/files/ENCFF578YVW/} processed by ChIP-seq ENCODE4 v1.6.1 GRCh38 pipeline was generated from a library with PBC1 value of 0.90. audit_warning: PBC2 (PCR Bottlenecking Coefficient 2, M1/M2) is the ratio of the number of genomic locations where exactly one read maps uniquely (M1) to the number of genomic locations where two reads map uniquely (M2). A PBC2 value in the range 0 - 1 is severe bottlenecking, 1 - 3 is moderate bottlenecking, 3 - 10 is mild bottlenecking, > 10 is no bottlenecking. PBC2 value > 10 is recommended, but > 3 is acceptable. ENCODE processed alignments file {ENCFF578YVW|/files/ENCFF578YVW/} processed by ChIP-seq ENCODE4 v1.6.1 GRCh38 pipeline was generated from a library with PBC2 value of 9.51. audit_warning: PBC1 (PCR Bottlenecking Coefficient 1, M1/M_distinct) is the ratio of the number of genomic locations where exactly one read maps uniquely (M1) to the number of genomic locations where some reads map (M_distinct). A PBC1 value in the range 0 - 0.5 is severe bottlenecking, 0.5 - 0.8 is moderate bottlenecking, 0.8 - 0.9 is mild bottlenecking, and > 0.9 is no bottlenecking. PBC1 value > 0.9 is recommended, but > 0.8 is acceptable. ENCODE processed alignments file {ENCFF073QOG|/files/ENCFF073QOG/} processed by ChIP-seq ENCODE4 v1.6.1 GRCh38 pipeline was generated from a library with PBC1 value of 0.80. audit_warning: PBC2 (PCR Bottlenecking Coefficient 2, M1/M2) is the ratio of the number of genomic locations where exactly one read maps uniquely (M1) to the number of genomic locations where two reads map uniquely (M2). A PBC2 value in the range 0 - 1 is severe bottlenecking, 1 - 3 is moderate bottlenecking, 3 - 10 is mild bottlenecking, > 10 is no bottlenecking. PBC2 value > 10 is recommended, but > 3 is acceptable. ENCODE processed alignments file {ENCFF073QOG|/files/ENCFF073QOG/} processed by ChIP-seq ENCODE4 v1.6.1 GRCh38 pipeline was generated from a library with PBC2 value of 4.96. |
| Labels |
|
Scores (1)
| ID | Type | Default annotation | Description | Histogram | Range | Summary |
|---|---|---|---|---|---|---|
| Histone_ChIP-seq_ENCSR350RYG | float |
Histone_ChIP-seq_ENCSR350RYG |
Histone_ChIP-seq ENCSR350RYG [biosample_summary="Homo sapiens DOHH2" and target="H3K27me3"]
|
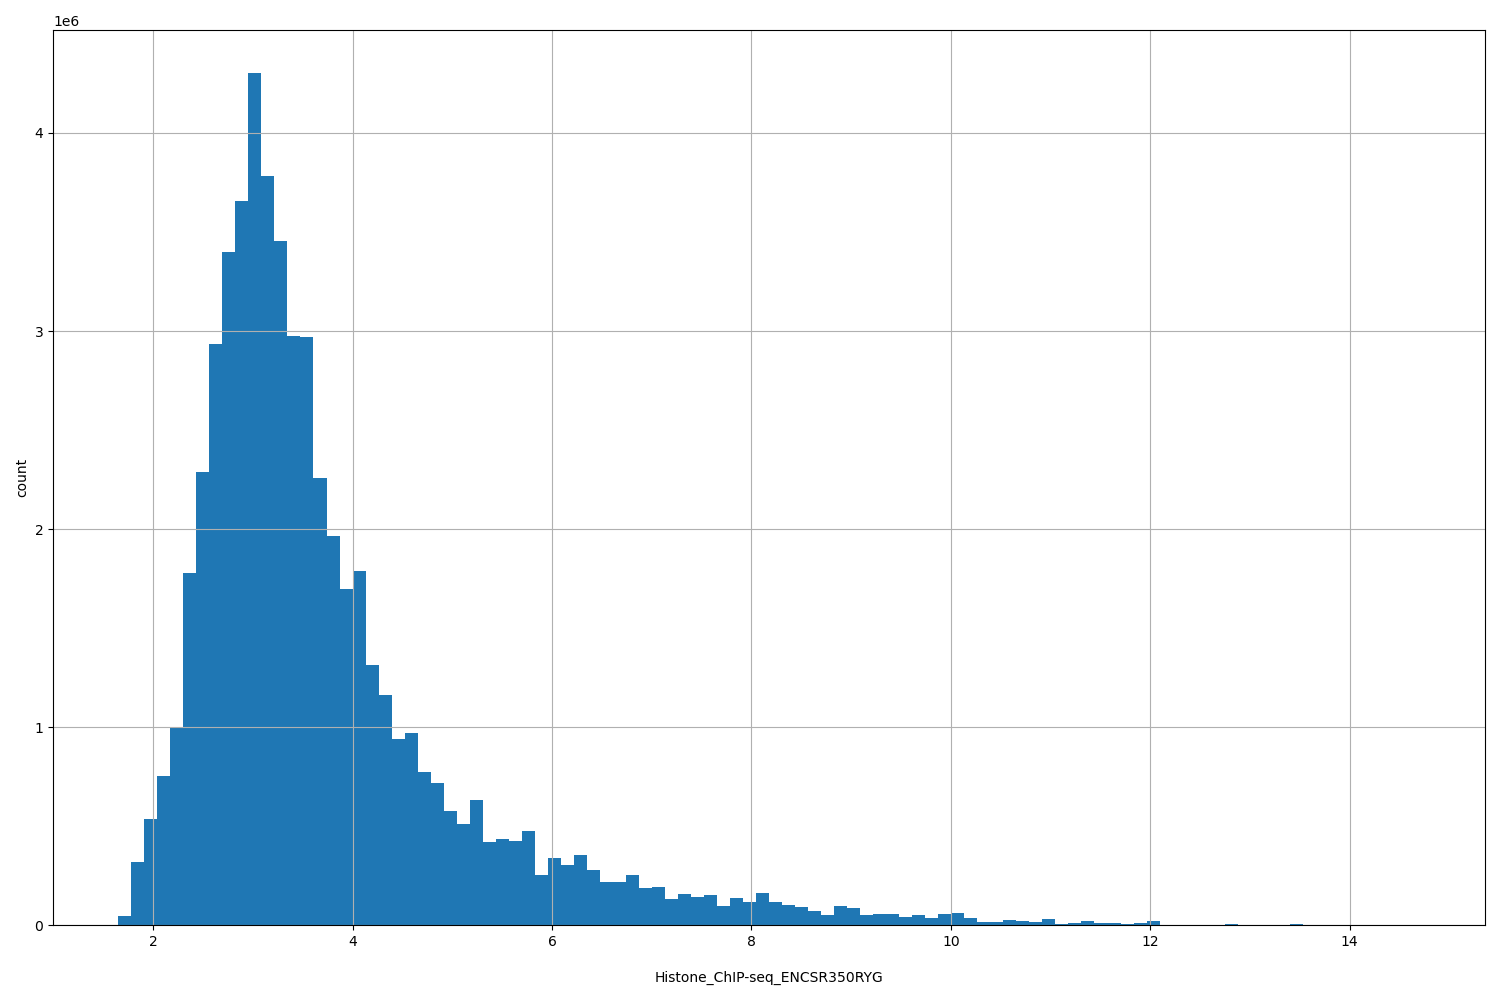 |
[1.65, 14.7] |
|
n counts base pairs; sd is the population standard deviation.
Coverage
| Chromosome | Covered positions | Covered % | Segments |
|---|---|---|---|
| all chromosomes | 56314330 | 1.75% | 100653 |
| chr1 | 6394215 | 2.57% | 11084 |
| chr2 | 4219834 | 1.74% | 7744 |
| chr3 | 3448842 | 1.74% | 6551 |
| chr4 | 1663033 | 0.87% | 3237 |
| chr5 | 2737226 | 1.51% | 5152 |
| chr6 | 3554000 | 2.08% | 6433 |
| chr7 | 4126665 | 2.59% | 7210 |
| chr8 | 2380594 | 1.64% | 4448 |
| chr9 | 2269647 | 1.64% | 4199 |
| chr10 | 3125492 | 2.34% | 5520 |
| chr11 | 2921253 | 2.16% | 5401 |
| chr12 | 3109634 | 2.33% | 5382 |
| chr13 | 1155604 | 1.01% | 2241 |
| chr14 | 1863088 | 1.74% | 3336 |
| chr15 | 2158339 | 2.12% | 3841 |
| chr16 | 1467248 | 1.62% | 2549 |
| chr17 | 3270892 | 3.93% | 5183 |
| chr18 | 1036515 | 1.29% | 2033 |
| chr19 | 1497863 | 2.56% | 2339 |
| chr20 | 2006139 | 3.11% | 3519 |
| chr21 | 517795 | 1.11% | 902 |
| chr22 | 1189700 | 2.34% | 1992 |
| chrX | 198558 | 0.13% | 352 |
| chrY | 2154 | <0.01% | 5 |
| 3342 contigs with no values (129077085 bp) | 0 | 0.00% | 0 |
Segment lengths
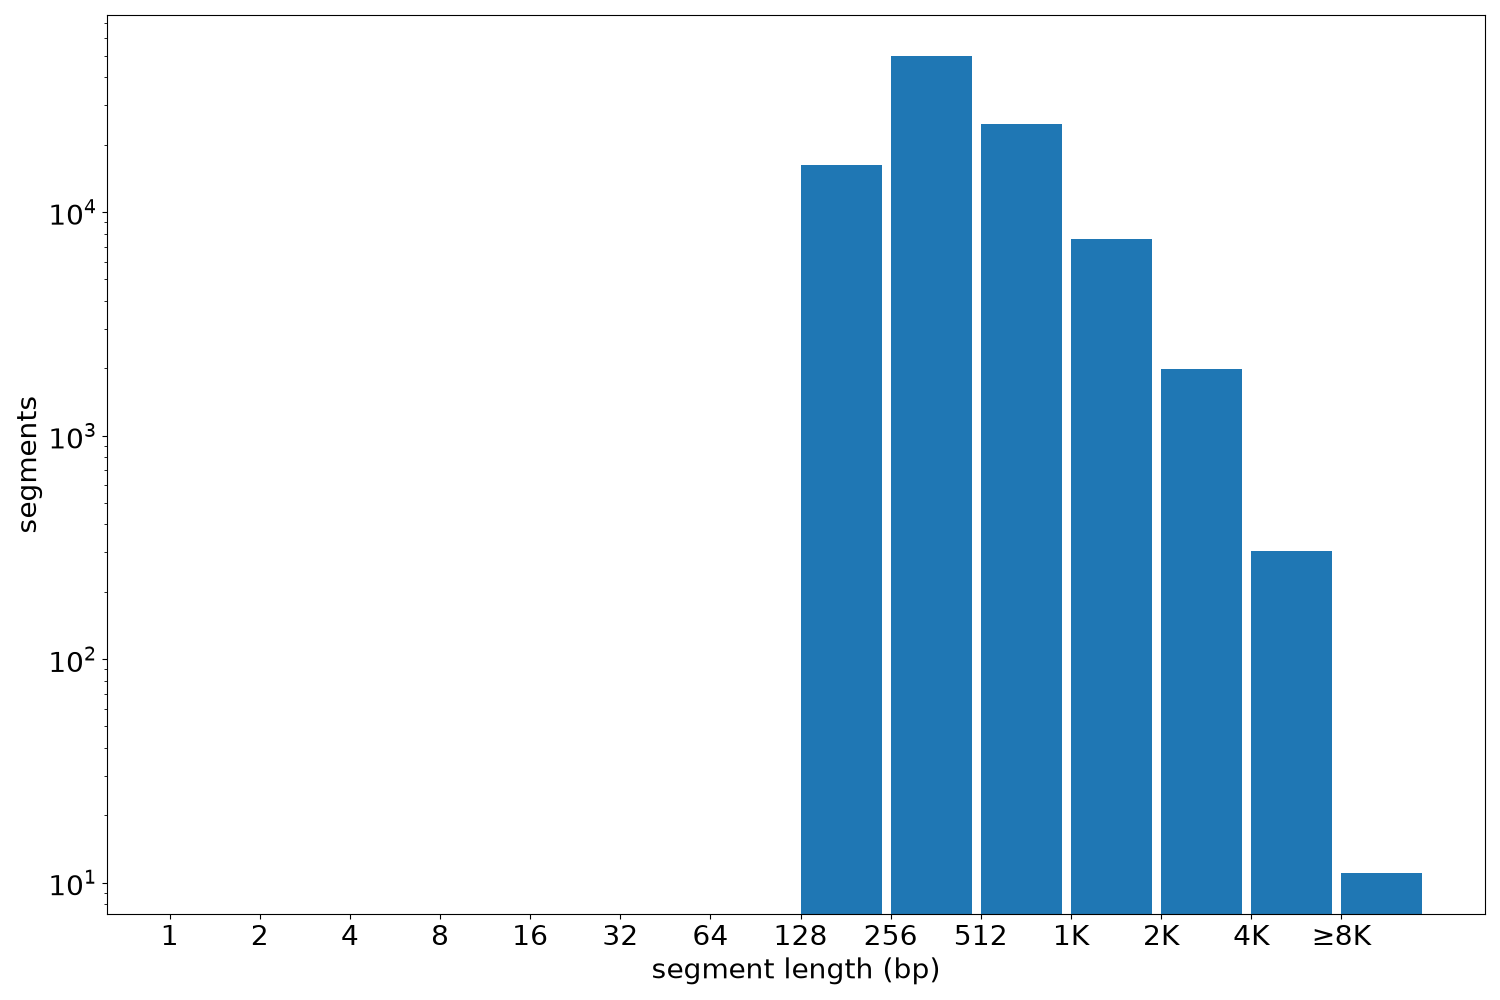
| segments | min | max | mean | median | |
|---|---|---|---|---|---|
| segments | 100653 | 205 | 11944 | 559.49 | 399 |
Files
| Filename | Size | md5 |
|---|---|---|
| ENCFF512UFS.bed.gz | 1.98 MB | e57cd58d1f699be8ebe197dd6c79f60b |
| ENCFF512UFS.tabix.bed.gz | 1014.63 KB | 39f3ac6ea24ad65a641ce769b341496f |
| ENCFF512UFS.tabix.bed.gz.tbi | 243.06 KB | 05ce1585c54fe3d781fc1d84fee0ffae |
| genomic_resource.yaml | 4.22 KB | f25905d39cdc5453ef825da22b0d846e |
| statistics/ |