Resource
| Id | Histone_ChIP-seq/ENCSR335YEH |
|---|---|
| Type | position_score |
| Version | 0 |
| Summary | Histone_ChIP-seq ENCSR335YEH [biosample_summary="Homo sapiens dorsolateral prefrontal cortex tissue male adult (71 years)" and target="H3K4me3"] |
| Description |
status: released biological_replicates: Rep 1 summary: male adult (71 years) output_type: pseudoreplicated peaks audit_internal_action: Released analysis {ENCAN613PFT|/analyses/ENCAN613PFT/} has in progress subobject quality standard {encode4-histone-chip|/quality-standards/encode4-histone-chip/} audit_warning: PBC1 (PCR Bottlenecking Coefficient 1, M1/M_distinct) is the ratio of the number of genomic locations where exactly one read maps uniquely (M1) to the number of genomic locations where some reads map (M_distinct). A PBC1 value in the range 0 - 0.5 is severe bottlenecking, 0.5 - 0.8 is moderate bottlenecking, 0.8 - 0.9 is mild bottlenecking, and > 0.9 is no bottlenecking. PBC1 value > 0.9 is recommended, but > 0.8 is acceptable. ENCODE processed alignments file {ENCFF849IOW|/files/ENCFF849IOW/} processed by ChIP-seq ENCODE4 v1.8.0 GRCh38 pipeline was generated from a library with PBC1 value of 0.88. audit_warning: PBC2 (PCR Bottlenecking Coefficient 2, M1/M2) is the ratio of the number of genomic locations where exactly one read maps uniquely (M1) to the number of genomic locations where two reads map uniquely (M2). A PBC2 value in the range 0 - 1 is severe bottlenecking, 1 - 3 is moderate bottlenecking, 3 - 10 is mild bottlenecking, > 10 is no bottlenecking. PBC2 value > 10 is recommended, but > 3 is acceptable. ENCODE processed alignments file {ENCFF849IOW|/files/ENCFF849IOW/} processed by ChIP-seq ENCODE4 v1.8.0 GRCh38 pipeline was generated from a library with PBC2 value of 9.17. |
| Labels |
|
Scores (1)
| ID | Type | Default annotation | Description | Histogram | Range | Summary |
|---|---|---|---|---|---|---|
| Histone_ChIP-seq_ENCSR335YEH | float |
Histone_ChIP-seq_ENCSR335YEH |
Histone_ChIP-seq ENCSR335YEH [biosample_summary="Homo sapiens dorsolateral prefrontal cortex tissue male adult (71 years)" and target="H3K4me3"]
|
 |
[1.78, 78.3] |
|
n counts base pairs; sd is the population standard deviation.
Coverage
| Chromosome | Covered positions | Covered % | Segments |
|---|---|---|---|
| all chromosomes | 77201452 | 2.40% | 43485 |
| chr1 | 7416609 | 2.98% | 4104 |
| chr2 | 5485648 | 2.26% | 3138 |
| chr3 | 4612313 | 2.33% | 2559 |
| chr4 | 3284281 | 1.73% | 1885 |
| chr5 | 3989499 | 2.20% | 2182 |
| chr6 | 4543174 | 2.66% | 2611 |
| chr7 | 3795050 | 2.38% | 2253 |
| chr8 | 3110493 | 2.14% | 1807 |
| chr9 | 3242140 | 2.34% | 1887 |
| chr10 | 3491080 | 2.61% | 2069 |
| chr11 | 4109233 | 3.04% | 2222 |
| chr12 | 4082086 | 3.06% | 2210 |
| chr13 | 1916238 | 1.68% | 1162 |
| chr14 | 2419925 | 2.26% | 1341 |
| chr15 | 2413204 | 2.37% | 1384 |
| chr16 | 2877358 | 3.19% | 1647 |
| chr17 | 4047139 | 4.86% | 2194 |
| chr18 | 1522778 | 1.89% | 905 |
| chr19 | 4244197 | 7.24% | 2279 |
| chr20 | 1943537 | 3.02% | 1093 |
| chr21 | 794786 | 1.70% | 477 |
| chr22 | 1643992 | 3.24% | 906 |
| chrX | 2147229 | 1.38% | 1137 |
| chrY | 69463 | 0.12% | 33 |
| 3342 contigs with no values (129077085 bp) | 0 | 0.00% | 0 |
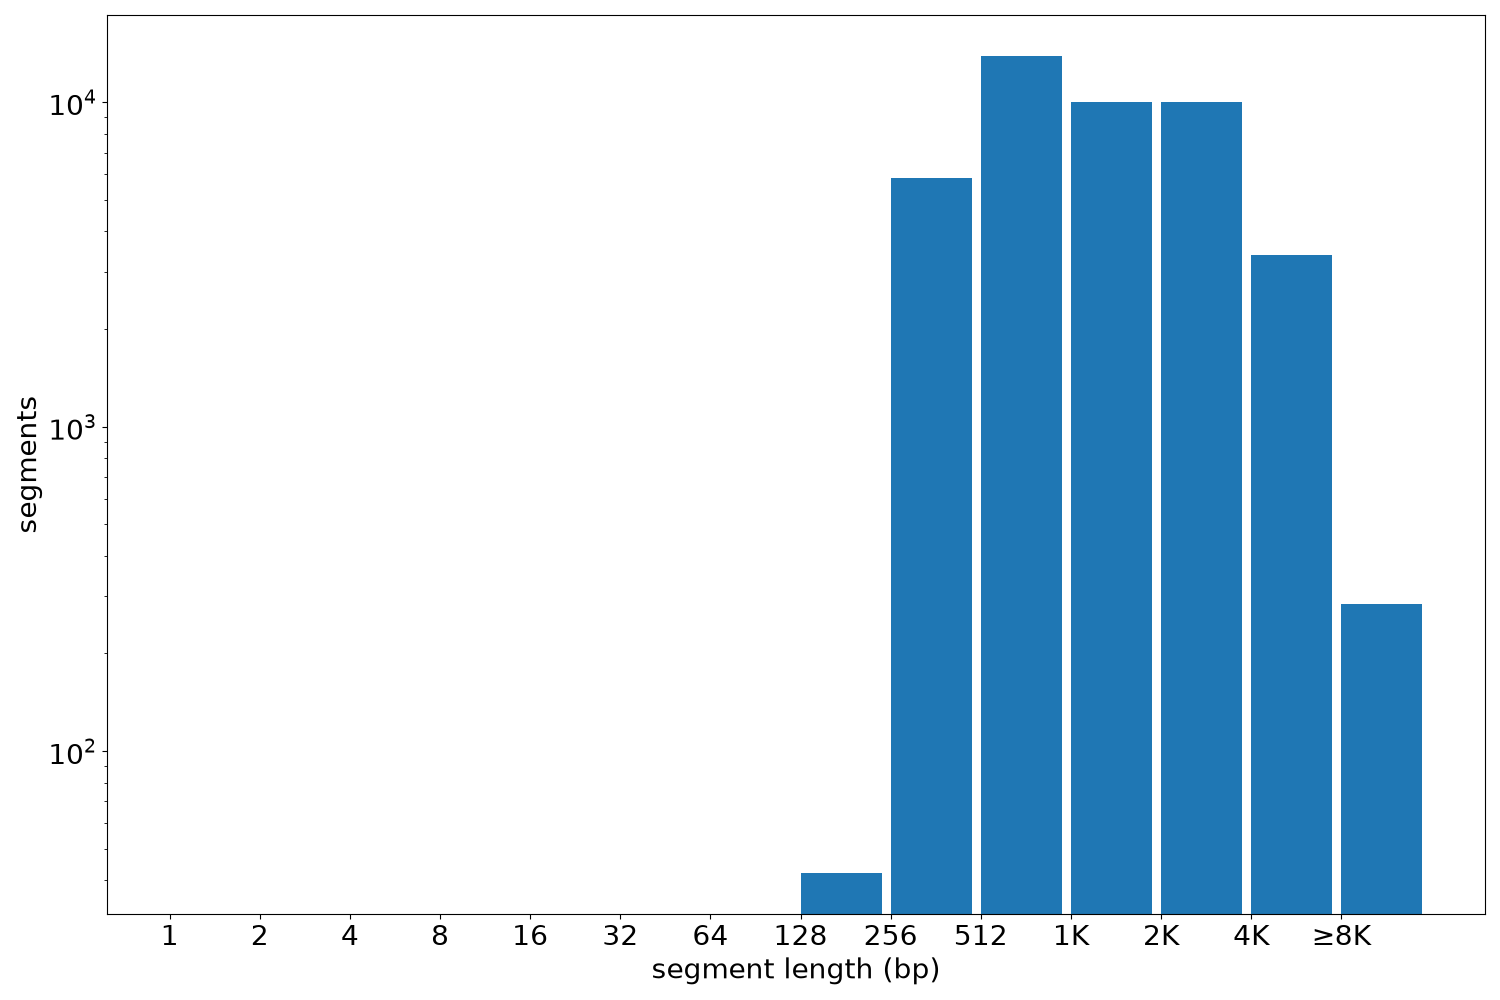
Segment lengths
| segments | min | max | mean | median | |
|---|---|---|---|---|---|
| segments | 43485 | 235 | 41477 | 1775.36 | 1140 |
Files
| Filename | Size | md5 |
|---|---|---|
| ENCFF695WNQ.bed.gz | 1.08 MB | 8d2854f15e857800e4c7a098b0cebae6 |
| ENCFF695WNQ.tabix.bed.gz | 487.51 KB | 6734a87d9da72808512e80dda7554ab9 |
| ENCFF695WNQ.tabix.bed.gz.tbi | 233.56 KB | b0ebd1f8996647d2b133a2f2499093e6 |
| genomic_resource.yaml | 2.83 KB | 2cdabc3725e51f9a4853fee98dd2f4db |
| statistics/ |