Resource
| Id | Histone_ChIP-seq/ENCSR335LTZ |
|---|---|
| Type | position_score |
| Version | 0 |
| Summary | Histone_ChIP-seq ENCSR335LTZ [biosample_summary="Homo sapiens parathyroid adenoma tissue male adult (65 years)" and target="H3K9ac"] |
| Description |
status: released biological_replicates: Rep 1 summary: male adult (65 years) output_type: pseudoreplicated peaks audit_internal_action: Archived analysis {ENCAN846PKB|/analyses/ENCAN846PKB/} has in progress subobject quality standard {encode3-histone-chip|/quality-standards/encode3-histone-chip/} audit_warning: PBC1 (PCR Bottlenecking Coefficient 1, M1/M_distinct) is the ratio of the number of genomic locations where exactly one read maps uniquely (M1) to the number of genomic locations where some reads map (M_distinct). A PBC1 value in the range 0 - 0.5 is severe bottlenecking, 0.5 - 0.8 is moderate bottlenecking, 0.8 - 0.9 is mild bottlenecking, and > 0.9 is no bottlenecking. PBC1 value > 0.9 is recommended, but > 0.8 is acceptable. ENCODE processed redacted alignments file {ENCFF902POM|/files/ENCFF902POM/} processed by ChIP-seq ENCODE3 hg19 pipeline was generated from a library with PBC1 value of 0.87. audit_warning: PBC2 (PCR Bottlenecking Coefficient 2, M1/M2) is the ratio of the number of genomic locations where exactly one read maps uniquely (M1) to the number of genomic locations where two reads map uniquely (M2). A PBC2 value in the range 0 - 1 is severe bottlenecking, 1 - 3 is moderate bottlenecking, 3 - 10 is mild bottlenecking, > 10 is no bottlenecking. PBC2 value > 10 is recommended, but > 3 is acceptable. ENCODE processed redacted alignments file {ENCFF902POM|/files/ENCFF902POM/} processed by ChIP-seq ENCODE3 hg19 pipeline was generated from a library with PBC2 value of 7.37. |
| Labels |
|
Scores (1)
| ID | Type | Default annotation | Description | Histogram | Range | Summary |
|---|---|---|---|---|---|---|
| Histone_ChIP-seq_ENCSR335LTZ | float |
Histone_ChIP-seq_ENCSR335LTZ |
Histone_ChIP-seq ENCSR335LTZ [biosample_summary="Homo sapiens parathyroid adenoma tissue male adult (65 years)" and target="H3K9ac"]
|
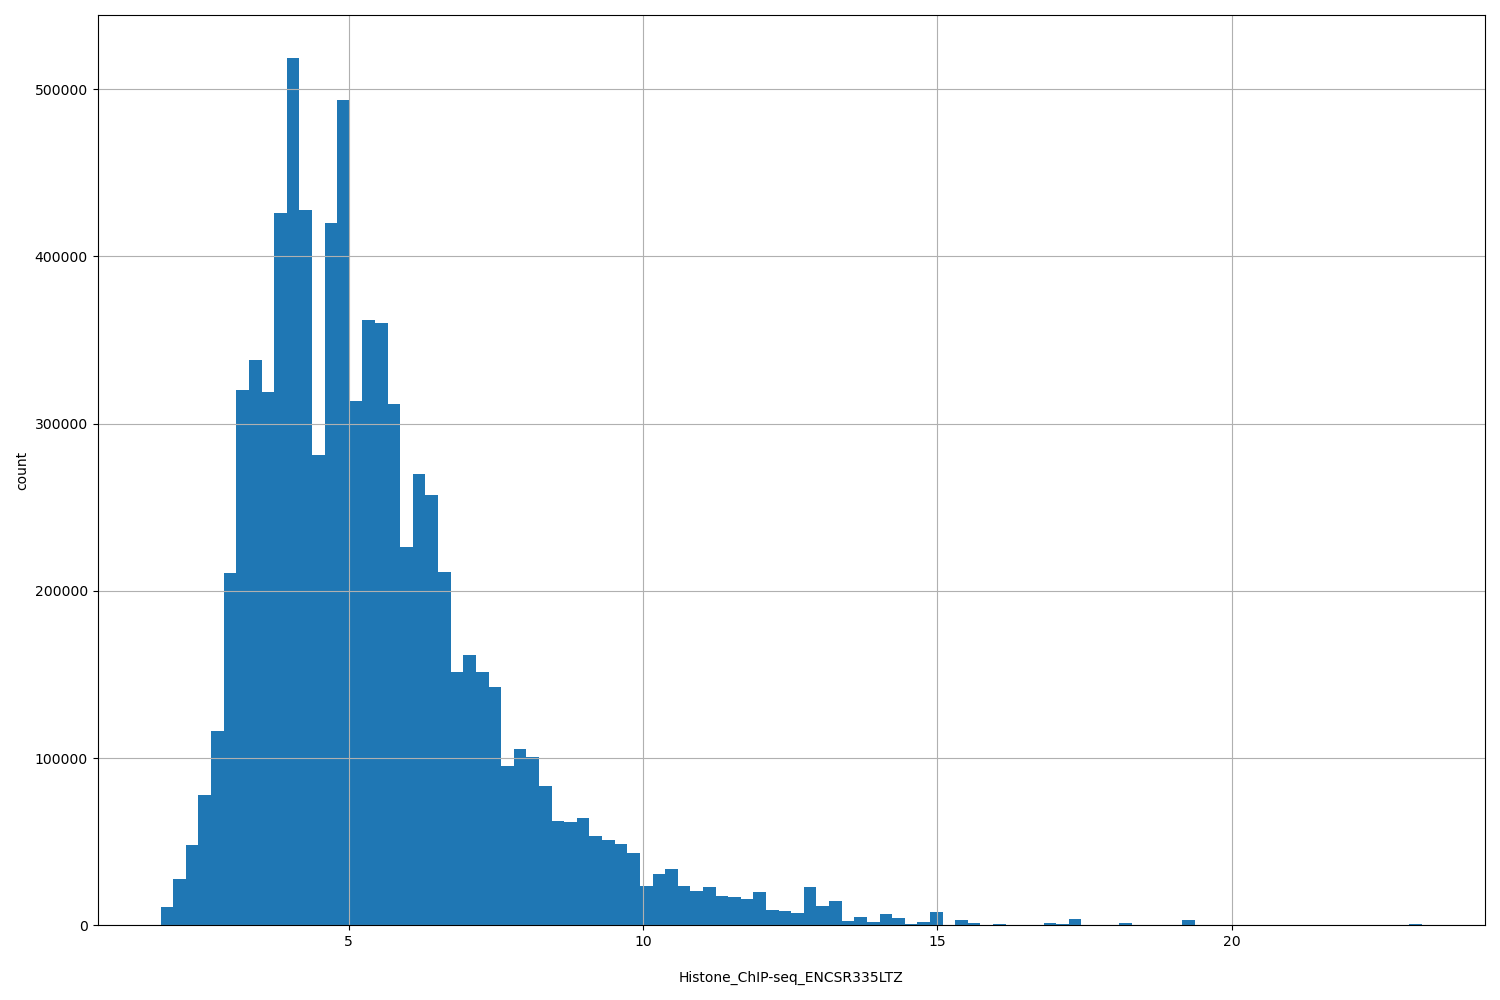 |
[1.81, 23.2] |
|
n counts base pairs; sd is the population standard deviation.
Coverage
| Chromosome | Covered positions | Covered % | Segments |
|---|---|---|---|
| all chromosomes | 8070655 | 0.25% | 12233 |
| chr1 | 510376 | 0.21% | 930 |
| chr2 | 637518 | 0.26% | 929 |
| chr3 | 568069 | 0.29% | 804 |
| chr4 | 171909 | 0.09% | 320 |
| chr5 | 448356 | 0.25% | 645 |
| chr6 | 523541 | 0.31% | 741 |
| chr7 | 453415 | 0.28% | 675 |
| chr8 | 353932 | 0.24% | 521 |
| chr9 | 199717 | 0.14% | 352 |
| chr10 | 408307 | 0.31% | 593 |
| chr11 | 300217 | 0.22% | 510 |
| chr12 | 537776 | 0.40% | 749 |
| chr13 | 80309 | 0.07% | 138 |
| chr14 | 371895 | 0.35% | 512 |
| chr15 | 149818 | 0.15% | 263 |
| chr16 | 367371 | 0.41% | 564 |
| chr17 | 564083 | 0.68% | 832 |
| chr18 | 164222 | 0.20% | 241 |
| chr19 | 630940 | 1.08% | 939 |
| chr20 | 308291 | 0.48% | 399 |
| chr21 | 49843 | 0.11% | 84 |
| chr22 | 106359 | 0.21% | 198 |
| chrX | 163959 | 0.11% | 293 |
| chrY | 432 | <0.01% | 1 |
| 3342 contigs with no values (129077085 bp) | 0 | 0.00% | 0 |
Segment lengths
| segments | min | max | mean | median | |
|---|---|---|---|---|---|
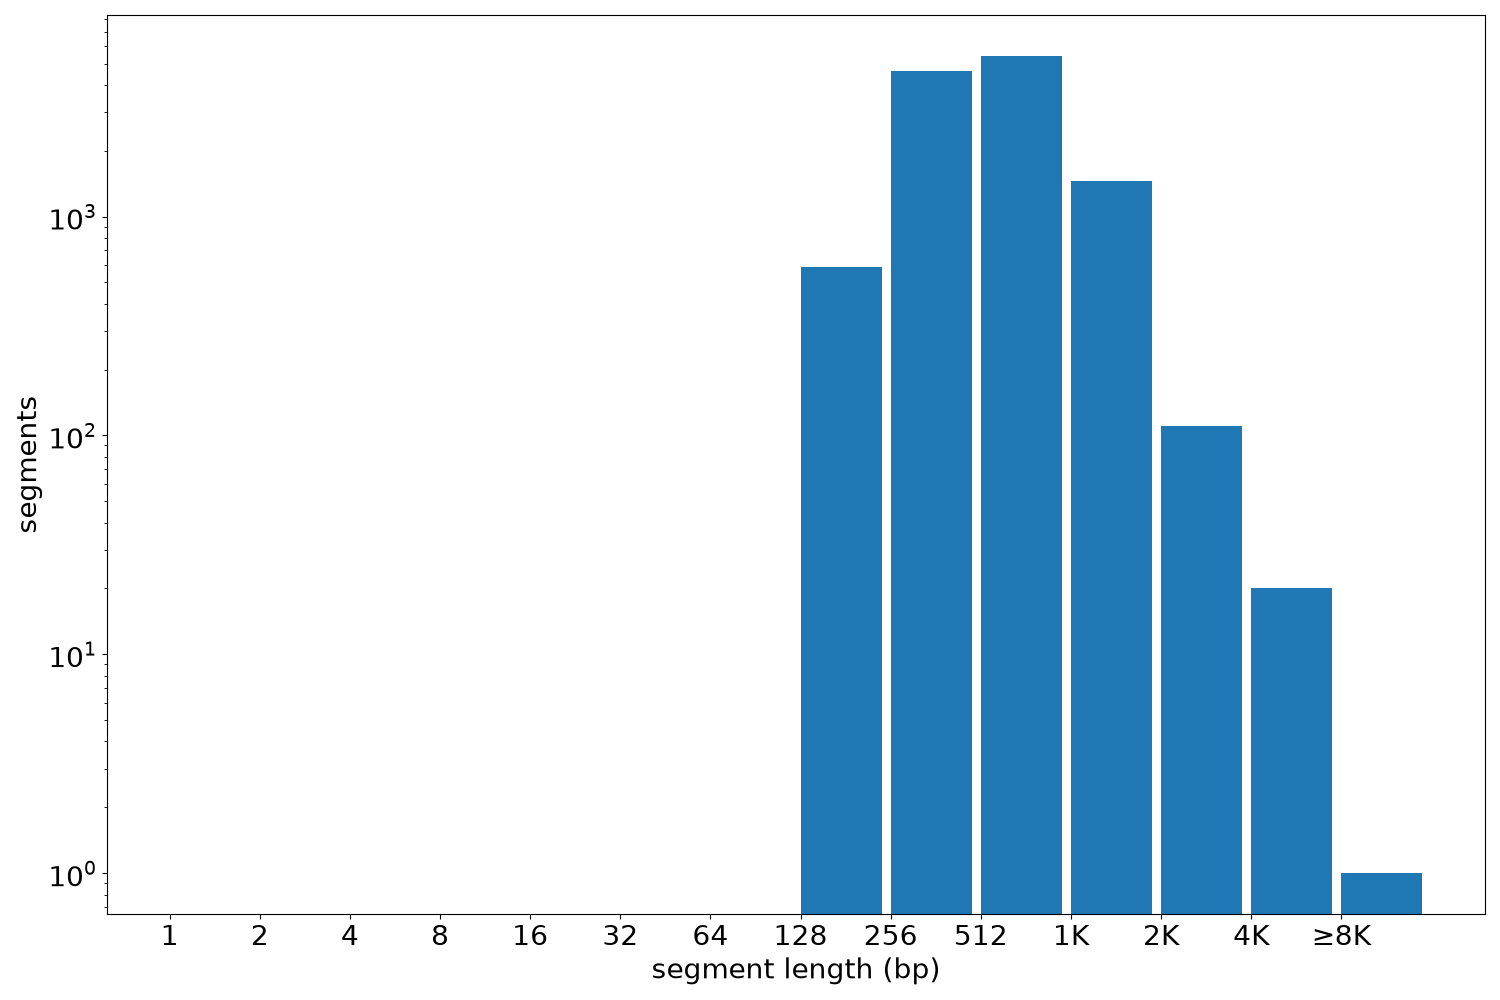
| segments | 12233 | 190 | 9656 | 659.74 | 564 |
Files
| Filename | Size | md5 |
|---|---|---|
| ENCFF012JHM.bed.gz | 268.09 KB | dc9e5894115812c2137b7ea14c1ede1e |
| ENCFF012JHM.tabix.bed.gz | 129.47 KB | e60034ee6e6a9cafcd819b636eb2587e |
| ENCFF012JHM.tabix.bed.gz.tbi | 85.15 KB | e4df1bf4849004099ca41332de87a42e |
| genomic_resource.yaml | 3.3 KB | d439fd5fa977c52250aee73d04eb6131 |
| statistics/ |