Resource
| Id | Histone_ChIP-seq/ENCSR306VSH |
|---|---|
| Type | position_score |
| Version | 0 |
| Summary | Histone_ChIP-seq ENCSR306VSH [biosample_summary="Homo sapiens Karpas-422" and target="H3K4me1"] |
| Description |
status: released biological_replicates: Rep 1, Rep 2 summary: output_type: pseudoreplicated peaks audit_internal_action: Released analysis {ENCAN558ERK|/analyses/ENCAN558ERK/} has in progress subobject quality standard {encode4-histone-chip|/quality-standards/encode4-histone-chip/} audit_internal_action: Released analysis {ENCAN558ERK|/analyses/ENCAN558ERK/} has in progress subobject document {b09cc33b-521b-41c6-b011-40379dc7c7bd|/documents/b09cc33b-521b-41c6-b011-40379dc7c7bd/} audit_warning: PBC1 (PCR Bottlenecking Coefficient 1, M1/M_distinct) is the ratio of the number of genomic locations where exactly one read maps uniquely (M1) to the number of genomic locations where some reads map (M_distinct). A PBC1 value in the range 0 - 0.5 is severe bottlenecking, 0.5 - 0.8 is moderate bottlenecking, 0.8 - 0.9 is mild bottlenecking, and > 0.9 is no bottlenecking. PBC1 value > 0.9 is recommended, but > 0.8 is acceptable. ENCODE processed alignments file {ENCFF724PUR|/files/ENCFF724PUR/} processed by ChIP-seq ENCODE4 v1.6.1 GRCh38 pipeline was generated from a library with PBC1 value of 0.85. audit_warning: PBC2 (PCR Bottlenecking Coefficient 2, M1/M2) is the ratio of the number of genomic locations where exactly one read maps uniquely (M1) to the number of genomic locations where two reads map uniquely (M2). A PBC2 value in the range 0 - 1 is severe bottlenecking, 1 - 3 is moderate bottlenecking, 3 - 10 is mild bottlenecking, > 10 is no bottlenecking. PBC2 value > 10 is recommended, but > 3 is acceptable. ENCODE processed alignments file {ENCFF724PUR|/files/ENCFF724PUR/} processed by ChIP-seq ENCODE4 v1.6.1 GRCh38 pipeline was generated from a library with PBC2 value of 6.73. |
| Labels |
|
Scores (1)
| ID | Type | Default annotation | Description | Histogram | Range | Summary |
|---|---|---|---|---|---|---|
| Histone_ChIP-seq_ENCSR306VSH | float |
Histone_ChIP-seq_ENCSR306VSH |
Histone_ChIP-seq ENCSR306VSH [biosample_summary="Homo sapiens Karpas-422" and target="H3K4me1"]
|
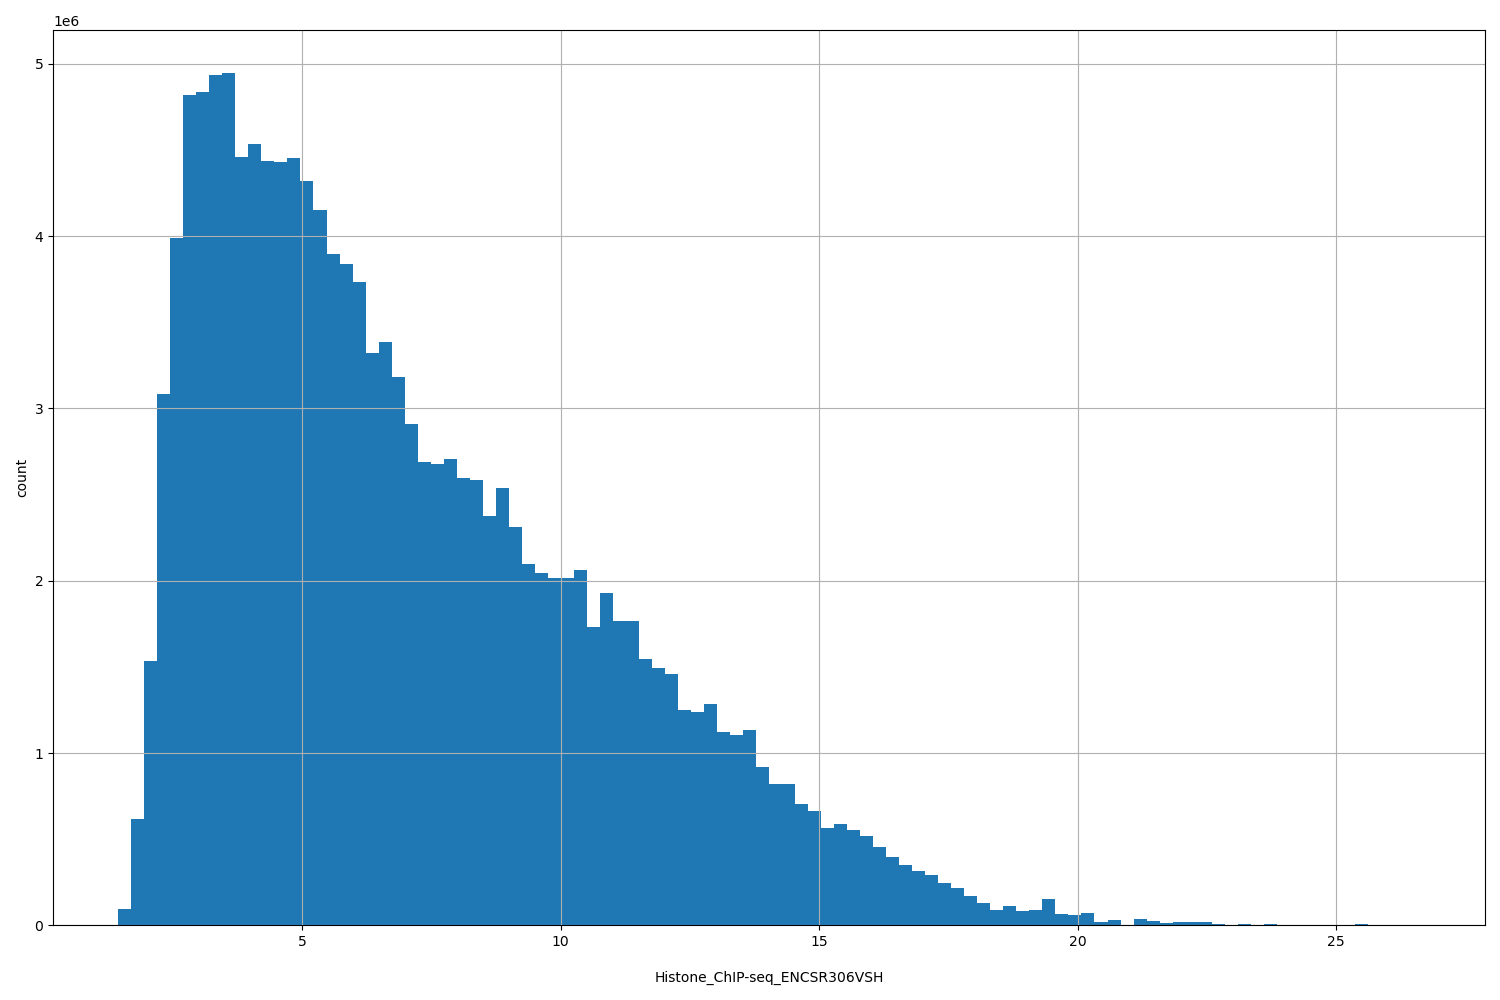 |
[1.44, 26.6] |
|
n counts base pairs; sd is the population standard deviation.
Coverage
| Chromosome | Covered positions | Covered % | Segments |
|---|---|---|---|
| all chromosomes | 143151410 | 4.45% | 117947 |
| chr1 | 13235389 | 5.32% | 11038 |
| chr2 | 12179655 | 5.03% | 10094 |
| chr3 | 10866908 | 5.48% | 8384 |
| chr4 | 6231290 | 3.28% | 5293 |
| chr5 | 7219366 | 3.98% | 5835 |
| chr6 | 7909464 | 4.63% | 6565 |
| chr7 | 6839861 | 4.29% | 5614 |
| chr8 | 6533319 | 4.50% | 4992 |
| chr9 | 5601417 | 4.05% | 4555 |
| chr10 | 6329914 | 4.73% | 5273 |
| chr11 | 7110990 | 5.26% | 5531 |
| chr12 | 7353668 | 5.52% | 6292 |
| chr13 | 3886067 | 3.40% | 3328 |
| chr14 | 6030342 | 5.63% | 4860 |
| chr15 | 4758173 | 4.67% | 3865 |
| chr16 | 4703156 | 5.21% | 4014 |
| chr17 | 6361398 | 7.64% | 5467 |
| chr18 | 3434529 | 4.27% | 2745 |
| chr19 | 4001880 | 6.83% | 3820 |
| chr20 | 4322230 | 6.71% | 3393 |
| chr21 | 1293487 | 2.77% | 1092 |
| chr22 | 3312876 | 6.52% | 2593 |
| chrX | 3636031 | 2.33% | 3304 |
| 3343 contigs with no values (186304500 bp) | 0 | 0.00% | 0 |
Segment lengths
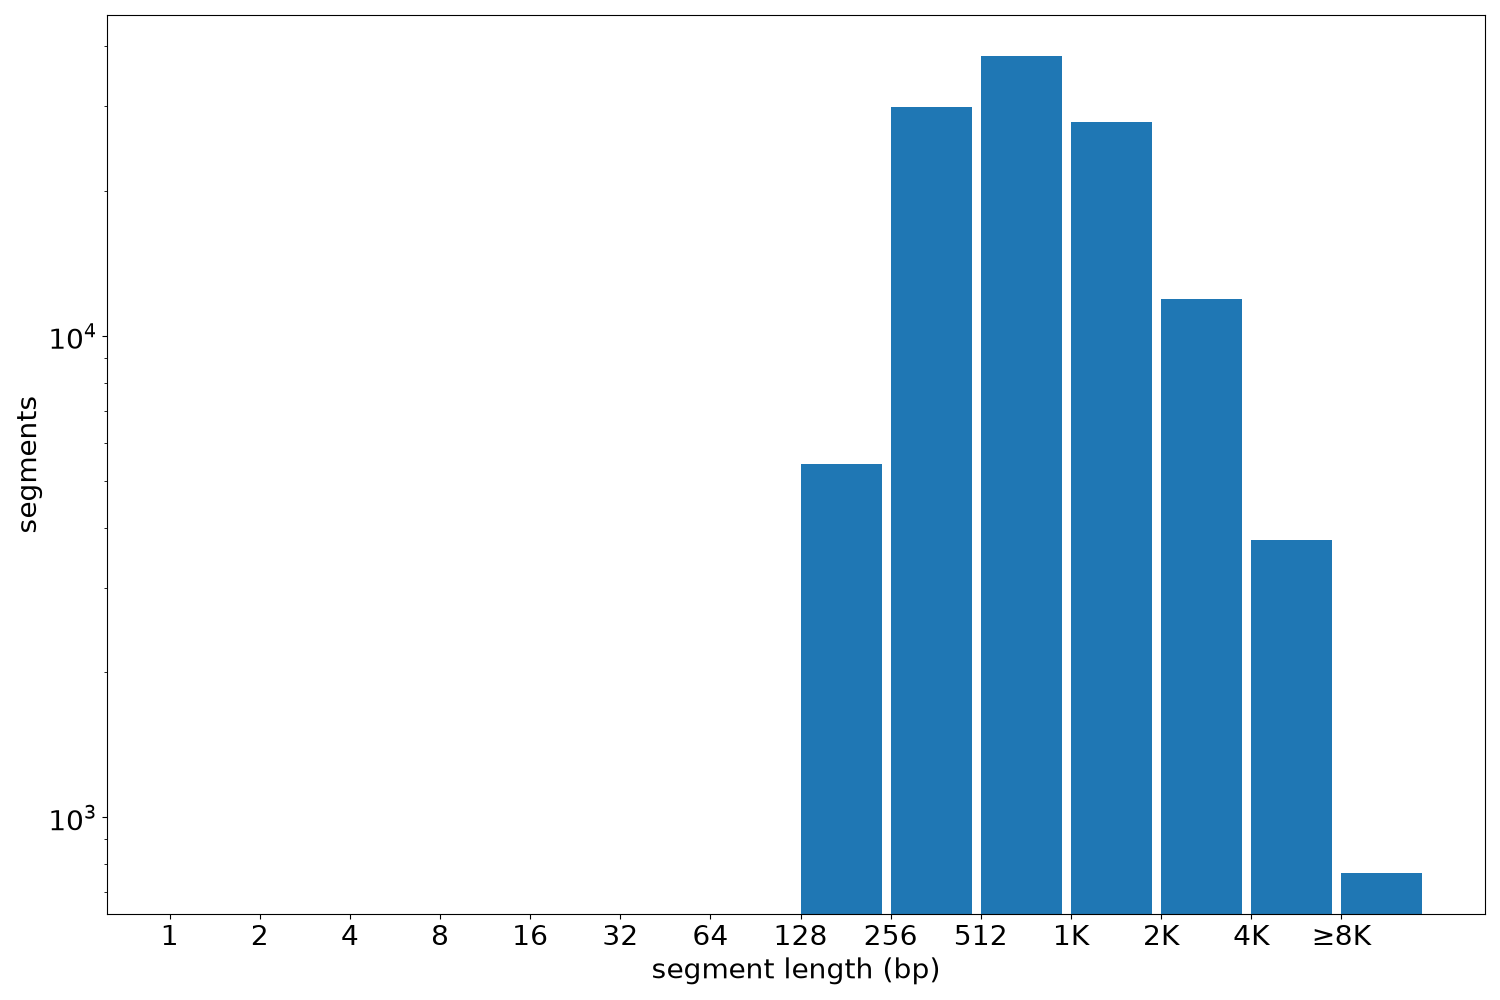
| segments | min | max | mean | median | |
|---|---|---|---|---|---|
| segments | 117947 | 198 | 38304 | 1213.69 | 786 |
Files
| Filename | Size | md5 |
|---|---|---|
| ENCFF103BFH.bed.gz | 3.04 MB | 7e0df757b1fbfc7203fc0387b392520e |
| ENCFF103BFH.tabix.bed.gz | 1.27 MB | bf7cee022237f94680be444c6aff16b8 |
| ENCFF103BFH.tabix.bed.gz.tbi | 295.97 KB | c950ad65160d0a5c3185297dfde4b7e8 |
| genomic_resource.yaml | 2.92 KB | 6583d47e37b3d8b0b6829bfd4c3eff1c |
| statistics/ |