Resource
| Id | Histone_ChIP-seq/ENCSR263ELQ |
|---|---|
| Type | position_score |
| Version | 0 |
| Summary | Histone_ChIP-seq ENCSR263ELQ [biosample_summary="Homo sapiens iPS DF 6.9" and target="H3K4me3"] |
| Description |
status: released biological_replicates: Rep 1, Rep 2 summary: output_type: replicated peaks audit_internal_action: Archived analysis {ENCAN042LSP|/analyses/ENCAN042LSP/} has in progress subobject quality standard {encode3-histone-chip|/quality-standards/encode3-histone-chip/} audit_warning: PBC1 (PCR Bottlenecking Coefficient 1, M1/M_distinct) is the ratio of the number of genomic locations where exactly one read maps uniquely (M1) to the number of genomic locations where some reads map (M_distinct). A PBC1 value in the range 0 - 0.5 is severe bottlenecking, 0.5 - 0.8 is moderate bottlenecking, 0.8 - 0.9 is mild bottlenecking, and > 0.9 is no bottlenecking. PBC1 value > 0.9 is recommended, but > 0.8 is acceptable. ENCODE processed alignments file {ENCFF771MGJ|/files/ENCFF771MGJ/} processed by ChIP-seq ENCODE3 hg19 pipeline was generated from a library with PBC1 value of 0.90. |
| Labels |
|
Scores (1)
| ID | Type | Default annotation | Description | Histogram | Range | Summary |
|---|---|---|---|---|---|---|
| Histone_ChIP-seq_ENCSR263ELQ | float |
Histone_ChIP-seq_ENCSR263ELQ |
Histone_ChIP-seq ENCSR263ELQ [biosample_summary="Homo sapiens iPS DF 6.9" and target="H3K4me3"]
|
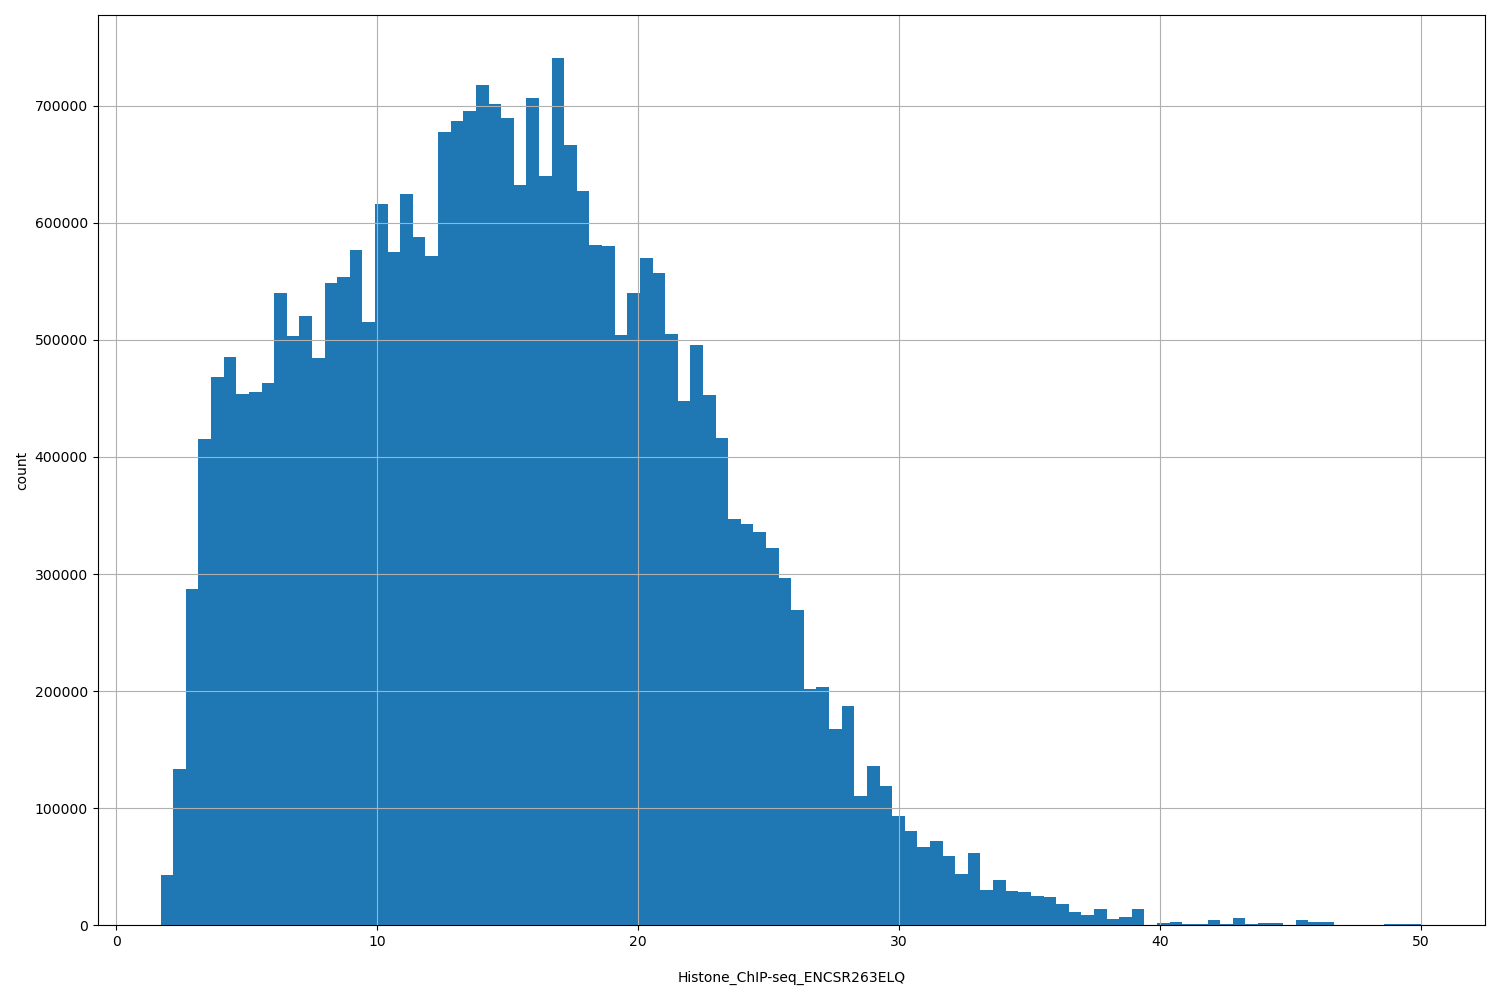 |
[1.7, 50] |
|
n counts base pairs; sd is the population standard deviation.
Coverage
| Chromosome | Covered positions | Covered % | Segments |
|---|---|---|---|
| all chromosomes | 28059547 | 0.87% | 27660 |
| chr1 | 2718517 | 1.09% | 2665 |
| chr2 | 1882453 | 0.78% | 1821 |
| chr3 | 1519068 | 0.77% | 1401 |
| chr4 | 1115324 | 0.59% | 1052 |
| chr5 | 1353450 | 0.75% | 1296 |
| chr6 | 1702276 | 1.00% | 1636 |
| chr7 | 1331191 | 0.84% | 1301 |
| chr8 | 1069897 | 0.74% | 966 |
| chr9 | 1135222 | 0.82% | 1099 |
| chr10 | 1157593 | 0.87% | 1126 |
| chr11 | 1513043 | 1.12% | 1473 |
| chr12 | 1385118 | 1.04% | 1310 |
| chr13 | 577476 | 0.50% | 546 |
| chr14 | 937179 | 0.88% | 897 |
| chr15 | 884419 | 0.87% | 862 |
| chr16 | 1128959 | 1.25% | 1153 |
| chr17 | 1621865 | 1.95% | 1659 |
| chr18 | 494533 | 0.62% | 443 |
| chr19 | 1914898 | 3.27% | 2226 |
| chr20 | 766883 | 1.19% | 763 |
| chr21 | 260250 | 0.56% | 243 |
| chr22 | 580004 | 1.14% | 641 |
| chrX | 978542 | 0.63% | 1053 |
| chrY | 31387 | 0.05% | 28 |
| 3342 contigs with no values (129077085 bp) | 0 | 0.00% | 0 |
Segment lengths
| segments | min | max | mean | median | |
|---|---|---|---|---|---|
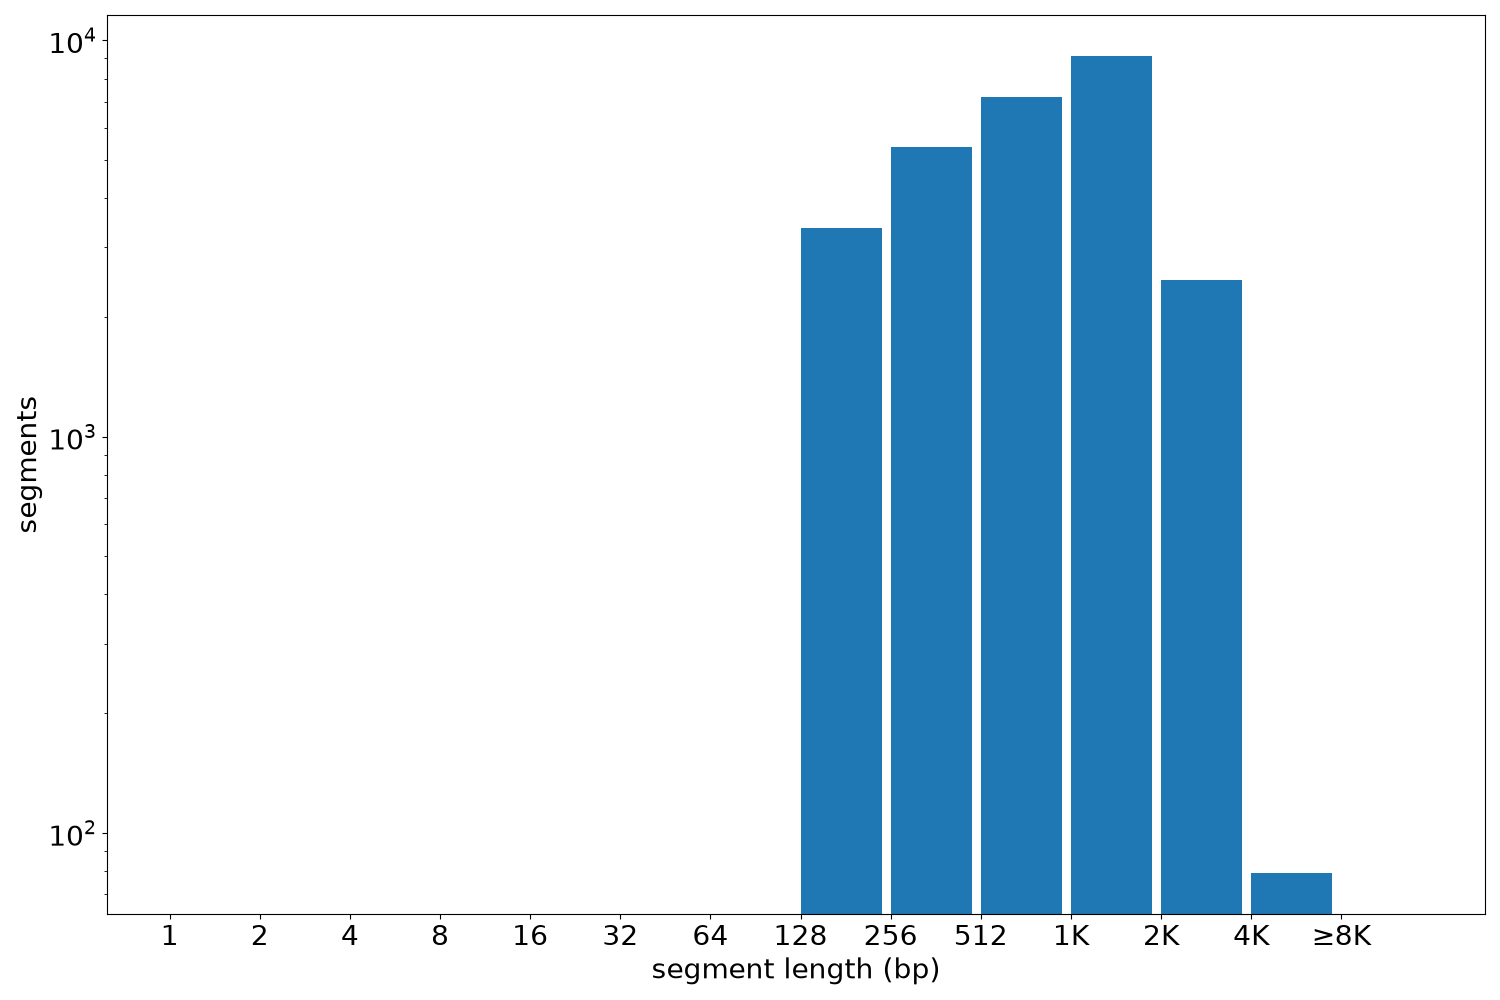
| segments | 27660 | 140 | 7881 | 1014.44 | 868 |
Files
| Filename | Size | md5 |
|---|---|---|
| ENCFF334CSR.bed.gz | 761.8 KB | 648523eb7186a49cd8f3a758ab81d435 |
| ENCFF334CSR.tabix.bed.gz | 318.99 KB | 0118a9005d5220652e98280f64cd4c3b |
| ENCFF334CSR.tabix.bed.gz.tbi | 146.59 KB | 6187044d46f3a8029b6f7aeb38e86c16 |
| genomic_resource.yaml | 2.04 KB | 023557c2228d772f6755bc1144c68b7f |
| statistics/ |