Resource
| Id | Histone_ChIP-seq/ENCSR249LNW |
|---|---|
| Type | position_score |
| Version | 0 |
| Summary | Histone_ChIP-seq ENCSR249LNW [biosample_summary="Homo sapiens parathyroid adenoma tissue male adult (65 years)" and target="H2AFZ"] |
| Description |
status: released biological_replicates: Rep 1 summary: male adult (65 years) output_type: pseudoreplicated peaks audit_internal_action: Released analysis {ENCAN719JZK|/analyses/ENCAN719JZK/} has in progress subobject quality standard {encode4-histone-chip|/quality-standards/encode4-histone-chip/} audit_warning: PBC1 (PCR Bottlenecking Coefficient 1, M1/M_distinct) is the ratio of the number of genomic locations where exactly one read maps uniquely (M1) to the number of genomic locations where some reads map (M_distinct). A PBC1 value in the range 0 - 0.5 is severe bottlenecking, 0.5 - 0.8 is moderate bottlenecking, 0.8 - 0.9 is mild bottlenecking, and > 0.9 is no bottlenecking. PBC1 value > 0.9 is recommended, but > 0.8 is acceptable. ENCODE processed redacted alignments file {ENCFF559MLV|/files/ENCFF559MLV/} processed by ChIP-seq ENCODE4 v1.7.0 GRCh38 pipeline was generated from a library with PBC1 value of 0.80. audit_warning: PBC2 (PCR Bottlenecking Coefficient 2, M1/M2) is the ratio of the number of genomic locations where exactly one read maps uniquely (M1) to the number of genomic locations where two reads map uniquely (M2). A PBC2 value in the range 0 - 1 is severe bottlenecking, 1 - 3 is moderate bottlenecking, 3 - 10 is mild bottlenecking, > 10 is no bottlenecking. PBC2 value > 10 is recommended, but > 3 is acceptable. ENCODE processed redacted alignments file {ENCFF559MLV|/files/ENCFF559MLV/} processed by ChIP-seq ENCODE4 v1.7.0 GRCh38 pipeline was generated from a library with PBC2 value of 4.83. |
| Labels |
|
Scores (1)
| ID | Type | Default annotation | Description | Histogram | Range | Summary |
|---|---|---|---|---|---|---|
| Histone_ChIP-seq_ENCSR249LNW | float |
Histone_ChIP-seq_ENCSR249LNW |
Histone_ChIP-seq ENCSR249LNW [biosample_summary="Homo sapiens parathyroid adenoma tissue male adult (65 years)" and target="H2AFZ"]
|
 |
[1.71, 26] |
|
n counts base pairs; sd is the population standard deviation.
Coverage
| Chromosome | Covered positions | Covered % | Segments |
|---|---|---|---|
| all chromosomes | 55261428 | 1.72% | 71097 |
| chr1 | 3931609 | 1.58% | 5217 |
| chr2 | 4846659 | 2.00% | 6414 |
| chr3 | 4130598 | 2.08% | 5253 |
| chr4 | 1626487 | 0.86% | 2188 |
| chr5 | 3657365 | 2.01% | 4750 |
| chr6 | 4053110 | 2.37% | 5144 |
| chr7 | 2805627 | 1.76% | 3569 |
| chr8 | 2954398 | 2.04% | 3905 |
| chr9 | 1516197 | 1.10% | 2090 |
| chr10 | 2891261 | 2.16% | 3732 |
| chr11 | 2026504 | 1.50% | 2731 |
| chr12 | 3432366 | 2.58% | 4297 |
| chr13 | 916129 | 0.80% | 1263 |
| chr14 | 2205012 | 2.06% | 2681 |
| chr15 | 1260996 | 1.24% | 1629 |
| chr16 | 1923290 | 2.13% | 2415 |
| chr17 | 2980440 | 3.58% | 3583 |
| chr18 | 1312119 | 1.63% | 1768 |
| chr19 | 2599857 | 4.44% | 3034 |
| chr20 | 1849265 | 2.87% | 2407 |
| chr21 | 303368 | 0.65% | 415 |
| chr22 | 728984 | 1.43% | 967 |
| chrX | 1309422 | 0.84% | 1643 |
| chrY | 365 | <0.01% | 2 |
| 3342 contigs with no values (129077085 bp) | 0 | 0.00% | 0 |
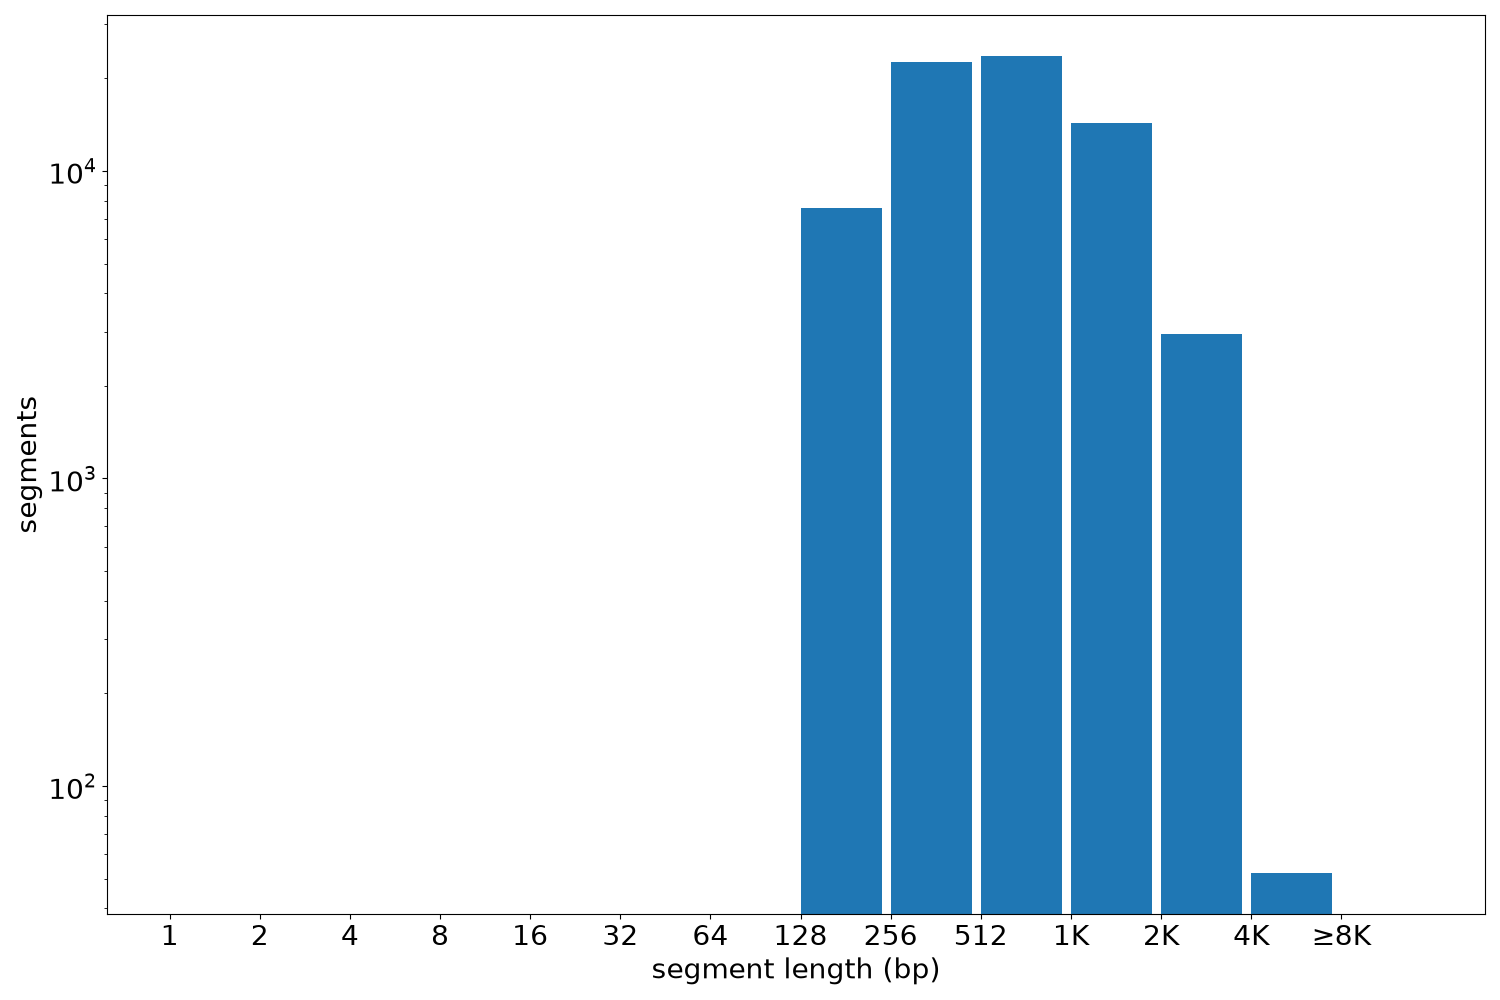
Segment lengths
| segments | min | max | mean | median | |
|---|---|---|---|---|---|
| segments | 71097 | 175 | 6483 | 777.27 | 592 |
Files
| Filename | Size | md5 |
|---|---|---|
| ENCFF755WYW.bed.gz | 1.58 MB | 428998b783b9f7627ba54fe8c39b9f6e |
| ENCFF755WYW.tabix.bed.gz | 748.28 KB | 2829457cdaf82ce9badb839ef23159a6 |
| ENCFF755WYW.tabix.bed.gz.tbi | 273.55 KB | 5a20897016efa59357b4435f24ed0526 |
| genomic_resource.yaml | 3.32 KB | 48cca63ec076e995e0da4f1f552924f1 |
| statistics/ |