Resource
| Id | Histone_ChIP-seq/ENCSR207VLY |
|---|---|
| Type | position_score |
| Version | 0 |
| Summary | Histone_ChIP-seq ENCSR207VLY [biosample_summary="Homo sapiens from a donor with amyotrophic lateral sclerosis; motor neuron" and target="H3K4me1"] |
| Description |
status: released biological_replicates: Rep 1, Rep 2 summary: male child (6 years) with amyotrophic lateral sclerosis output_type: pseudoreplicated peaks audit_internal_action: Released analysis {ENCAN476GZX|/analyses/ENCAN476GZX/} has in progress subobject quality standard {encode4-histone-chip|/quality-standards/encode4-histone-chip/} audit_warning: PBC1 (PCR Bottlenecking Coefficient 1, M1/M_distinct) is the ratio of the number of genomic locations where exactly one read maps uniquely (M1) to the number of genomic locations where some reads map (M_distinct). A PBC1 value in the range 0 - 0.5 is severe bottlenecking, 0.5 - 0.8 is moderate bottlenecking, 0.8 - 0.9 is mild bottlenecking, and > 0.9 is no bottlenecking. PBC1 value > 0.9 is recommended, but > 0.8 is acceptable. ENCODE processed alignments file {ENCFF973BRL|/files/ENCFF973BRL/} processed by ChIP-seq ENCODE4 v1.6.1 GRCh38 pipeline was generated from a library with PBC1 value of 0.81. audit_warning: PBC2 (PCR Bottlenecking Coefficient 2, M1/M2) is the ratio of the number of genomic locations where exactly one read maps uniquely (M1) to the number of genomic locations where two reads map uniquely (M2). A PBC2 value in the range 0 - 1 is severe bottlenecking, 1 - 3 is moderate bottlenecking, 3 - 10 is mild bottlenecking, > 10 is no bottlenecking. PBC2 value > 10 is recommended, but > 3 is acceptable. ENCODE processed alignments file {ENCFF973BRL|/files/ENCFF973BRL/} processed by ChIP-seq ENCODE4 v1.6.1 GRCh38 pipeline was generated from a library with PBC2 value of 4.99. audit_warning: PBC1 (PCR Bottlenecking Coefficient 1, M1/M_distinct) is the ratio of the number of genomic locations where exactly one read maps uniquely (M1) to the number of genomic locations where some reads map (M_distinct). A PBC1 value in the range 0 - 0.5 is severe bottlenecking, 0.5 - 0.8 is moderate bottlenecking, 0.8 - 0.9 is mild bottlenecking, and > 0.9 is no bottlenecking. PBC1 value > 0.9 is recommended, but > 0.8 is acceptable. ENCODE processed alignments file {ENCFF398AMQ|/files/ENCFF398AMQ/} processed by ChIP-seq ENCODE4 v1.6.1 GRCh38 pipeline was generated from a library with PBC1 value of 0.82. audit_warning: PBC2 (PCR Bottlenecking Coefficient 2, M1/M2) is the ratio of the number of genomic locations where exactly one read maps uniquely (M1) to the number of genomic locations where two reads map uniquely (M2). A PBC2 value in the range 0 - 1 is severe bottlenecking, 1 - 3 is moderate bottlenecking, 3 - 10 is mild bottlenecking, > 10 is no bottlenecking. PBC2 value > 10 is recommended, but > 3 is acceptable. ENCODE processed alignments file {ENCFF398AMQ|/files/ENCFF398AMQ/} processed by ChIP-seq ENCODE4 v1.6.1 GRCh38 pipeline was generated from a library with PBC2 value of 5.30. |
| Labels |
|
Scores (1)
| ID | Type | Default annotation | Description | Histogram | Range | Summary |
|---|---|---|---|---|---|---|
| Histone_ChIP-seq_ENCSR207VLY | float |
Histone_ChIP-seq_ENCSR207VLY |
Histone_ChIP-seq ENCSR207VLY [biosample_summary="Homo sapiens from a donor with amyotrophic lateral sclerosis; motor neuron" and target="H3K4me1"]
|
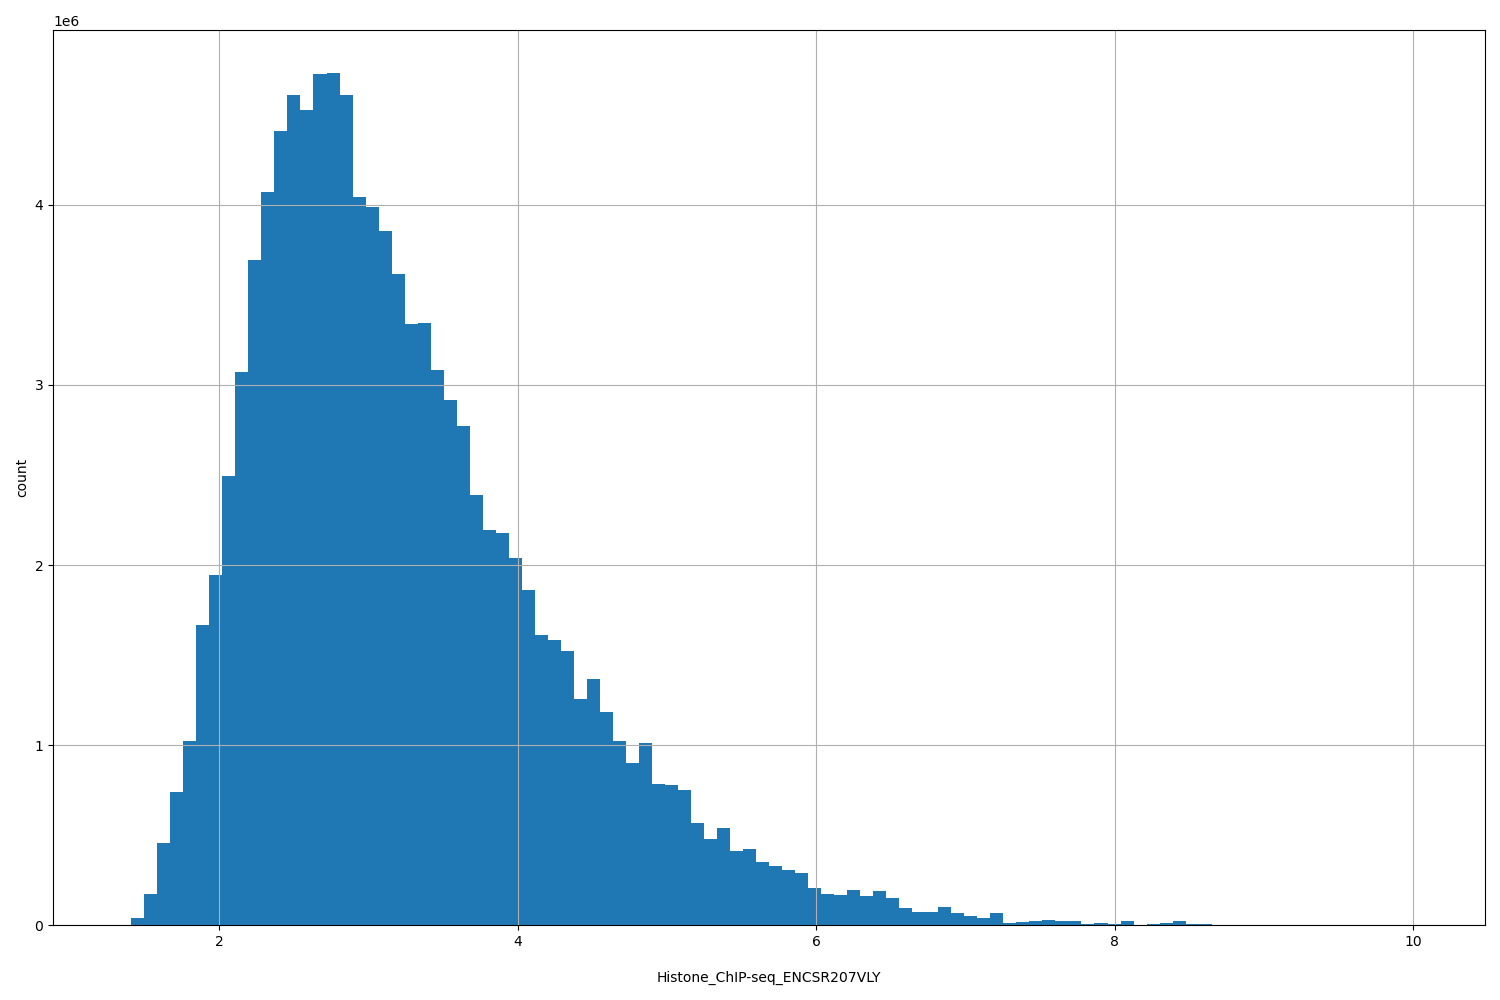 |
[1.32, 10] |
|
n counts base pairs; sd is the population standard deviation.
Coverage
| Chromosome | Covered positions | Covered % | Segments |
|---|---|---|---|
| all chromosomes | 108183448 | 3.36% | 138363 |
| chr1 | 12901888 | 5.18% | 14620 |
| chr2 | 8677287 | 3.58% | 11310 |
| chr3 | 6253795 | 3.15% | 8791 |
| chr4 | 3970436 | 2.09% | 5855 |
| chr5 | 5550414 | 3.06% | 7573 |
| chr6 | 5633040 | 3.30% | 7554 |
| chr7 | 4555757 | 2.86% | 6345 |
| chr8 | 4505168 | 3.10% | 6014 |
| chr9 | 4993929 | 3.61% | 6171 |
| chr10 | 6095159 | 4.56% | 7557 |
| chr11 | 6558576 | 4.86% | 7906 |
| chr12 | 4518957 | 3.39% | 5996 |
| chr13 | 2390367 | 2.09% | 3514 |
| chr14 | 3534806 | 3.30% | 4476 |
| chr15 | 3802258 | 3.73% | 4801 |
| chr16 | 4288884 | 4.75% | 5227 |
| chr17 | 5669321 | 6.81% | 6282 |
| chr18 | 2397084 | 2.98% | 3326 |
| chr19 | 3136389 | 5.35% | 3963 |
| chr20 | 3604430 | 5.59% | 4346 |
| chr21 | 1115788 | 2.39% | 1506 |
| chr22 | 2593594 | 5.10% | 2965 |
| chrX | 1428413 | 0.92% | 2245 |
| chrY | 7708 | 0.01% | 20 |
| 3342 contigs with no values (129077085 bp) | 0 | 0.00% | 0 |
Segment lengths
| segments | min | max | mean | median | |
|---|---|---|---|---|---|
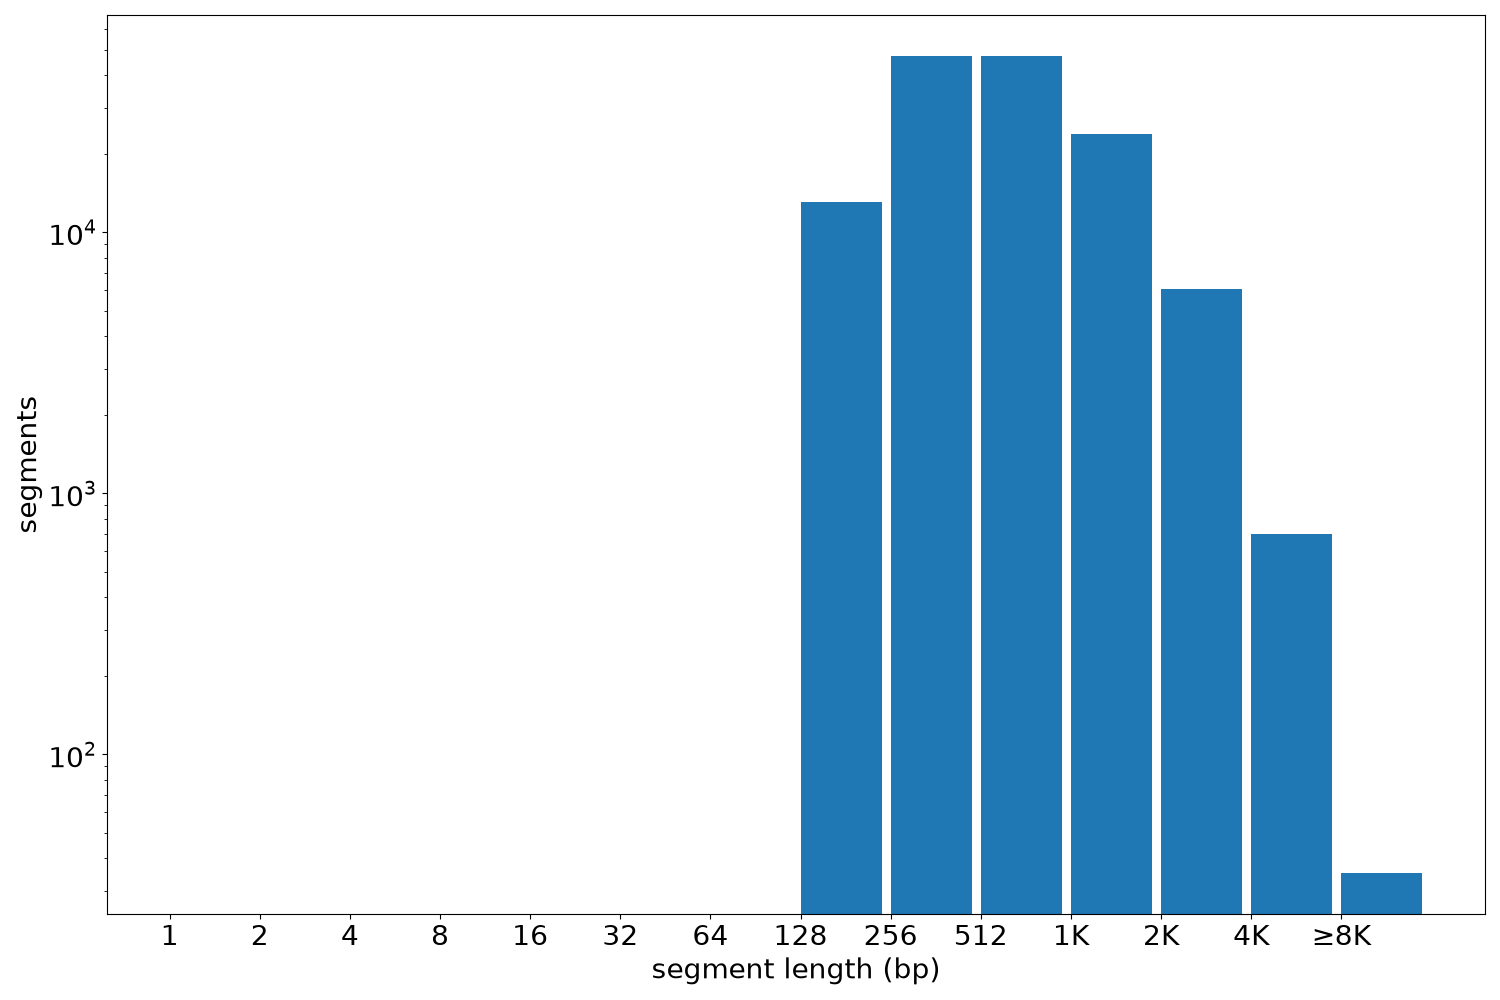
| segments | 138363 | 190 | 17836 | 781.88 | 574 |
Files
| Filename | Size | md5 |
|---|---|---|
| ENCFF456GWH.bed.gz | 3.41 MB | 99d8268d33b64c64ec22e8ebb8baff14 |
| ENCFF456GWH.tabix.bed.gz | 1.47 MB | 34d055c71dcad5d39f8ce09e24d8bf7b |
| ENCFF456GWH.tabix.bed.gz.tbi | 401.57 KB | 2e15dbd50c8c5ed4f325e613d12a12aa |
| genomic_resource.yaml | 4.19 KB | b82067e18240e52df2abd4507a89df11 |
| statistics/ |