Resource
| Id | Histone_ChIP-seq/ENCSR161XBV |
|---|---|
| Type | position_score |
| Version | 0 |
| Summary | Histone_ChIP-seq ENCSR161XBV [biosample_summary="Homo sapiens naive thymus-derived CD4-positive, alpha-beta T cell" and target="H3K4me3"] |
| Description |
status: released biological_replicates: Rep 1, Rep 2 summary: output_type: pseudoreplicated peaks audit_internal_action: Released analysis {ENCAN065IZU|/analyses/ENCAN065IZU/} has in progress subobject quality standard {encode4-histone-chip|/quality-standards/encode4-histone-chip/} audit_warning: PBC1 (PCR Bottlenecking Coefficient 1, M1/M_distinct) is the ratio of the number of genomic locations where exactly one read maps uniquely (M1) to the number of genomic locations where some reads map (M_distinct). A PBC1 value in the range 0 - 0.5 is severe bottlenecking, 0.5 - 0.8 is moderate bottlenecking, 0.8 - 0.9 is mild bottlenecking, and > 0.9 is no bottlenecking. PBC1 value > 0.9 is recommended, but > 0.8 is acceptable. ENCODE processed redacted alignments file {ENCFF758IRK|/files/ENCFF758IRK/} processed by ChIP-seq ENCODE4 v1.7.0 GRCh38 pipeline was generated from a library with PBC1 value of 0.83. audit_warning: PBC2 (PCR Bottlenecking Coefficient 2, M1/M2) is the ratio of the number of genomic locations where exactly one read maps uniquely (M1) to the number of genomic locations where two reads map uniquely (M2). A PBC2 value in the range 0 - 1 is severe bottlenecking, 1 - 3 is moderate bottlenecking, 3 - 10 is mild bottlenecking, > 10 is no bottlenecking. PBC2 value > 10 is recommended, but > 3 is acceptable. ENCODE processed redacted alignments file {ENCFF758IRK|/files/ENCFF758IRK/} processed by ChIP-seq ENCODE4 v1.7.0 GRCh38 pipeline was generated from a library with PBC2 value of 5.66. |
| Labels |
|
Scores (1)
| ID | Type | Default annotation | Description | Histogram | Range | Summary |
|---|---|---|---|---|---|---|
| Histone_ChIP-seq_ENCSR161XBV | float |
Histone_ChIP-seq_ENCSR161XBV |
Histone_ChIP-seq ENCSR161XBV [biosample_summary="Homo sapiens naive thymus-derived CD4-positive, alpha-beta T cell" and target="H3K4me3"]
|
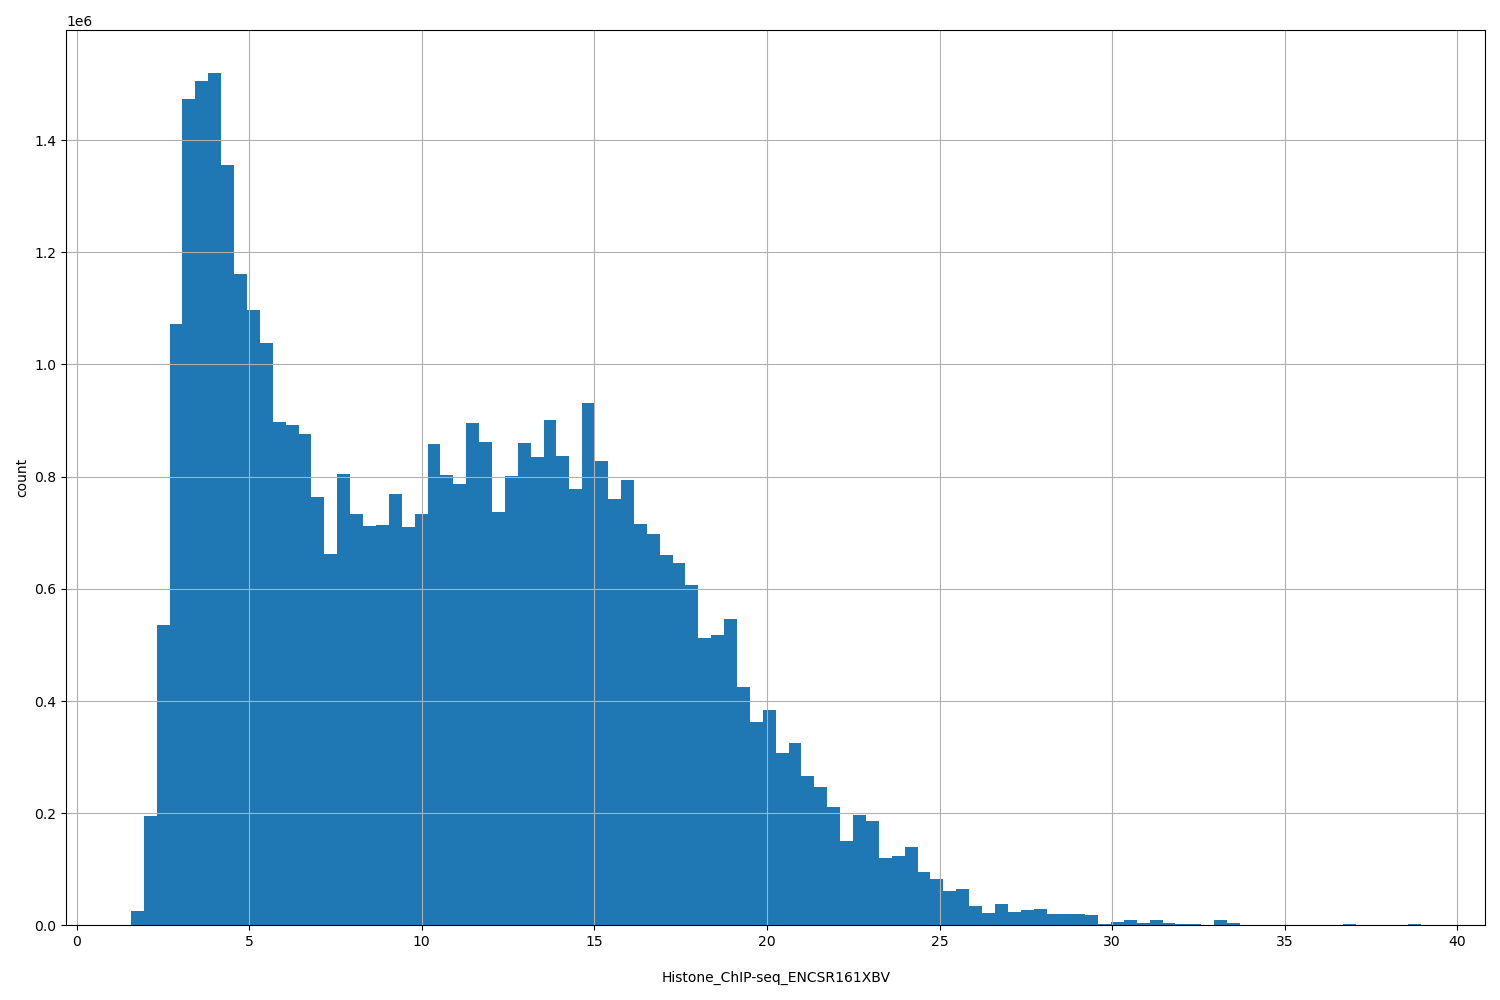 |
[1.58, 38.9] |
|
n counts base pairs; sd is the population standard deviation.
Coverage
| Chromosome | Covered positions | Covered % | Segments |
|---|---|---|---|
| all chromosomes | 42476959 | 1.32% | 33153 |
| chr1 | 4341515 | 1.74% | 3337 |
| chr2 | 3070074 | 1.27% | 2432 |
| chr3 | 2372239 | 1.20% | 1826 |
| chr4 | 1496950 | 0.79% | 1184 |
| chr5 | 1997502 | 1.10% | 1464 |
| chr6 | 2578366 | 1.51% | 1889 |
| chr7 | 1935695 | 1.21% | 1577 |
| chr8 | 1441123 | 0.99% | 1182 |
| chr9 | 1605255 | 1.16% | 1285 |
| chr10 | 1783198 | 1.33% | 1404 |
| chr11 | 2304351 | 1.71% | 1663 |
| chr12 | 2289008 | 1.72% | 1768 |
| chr13 | 929414 | 0.81% | 714 |
| chr14 | 1665339 | 1.56% | 1244 |
| chr15 | 1322851 | 1.30% | 1010 |
| chr16 | 1606463 | 1.78% | 1310 |
| chr17 | 2496314 | 3.00% | 1928 |
| chr18 | 644879 | 0.80% | 528 |
| chr19 | 2737652 | 4.67% | 2263 |
| chr20 | 1066160 | 1.65% | 842 |
| chr21 | 474841 | 1.02% | 403 |
| chr22 | 983346 | 1.94% | 784 |
| chrX | 1269379 | 0.81% | 1062 |
| chrY | 65045 | 0.11% | 54 |
| 3342 contigs with no values (129077085 bp) | 0 | 0.00% | 0 |
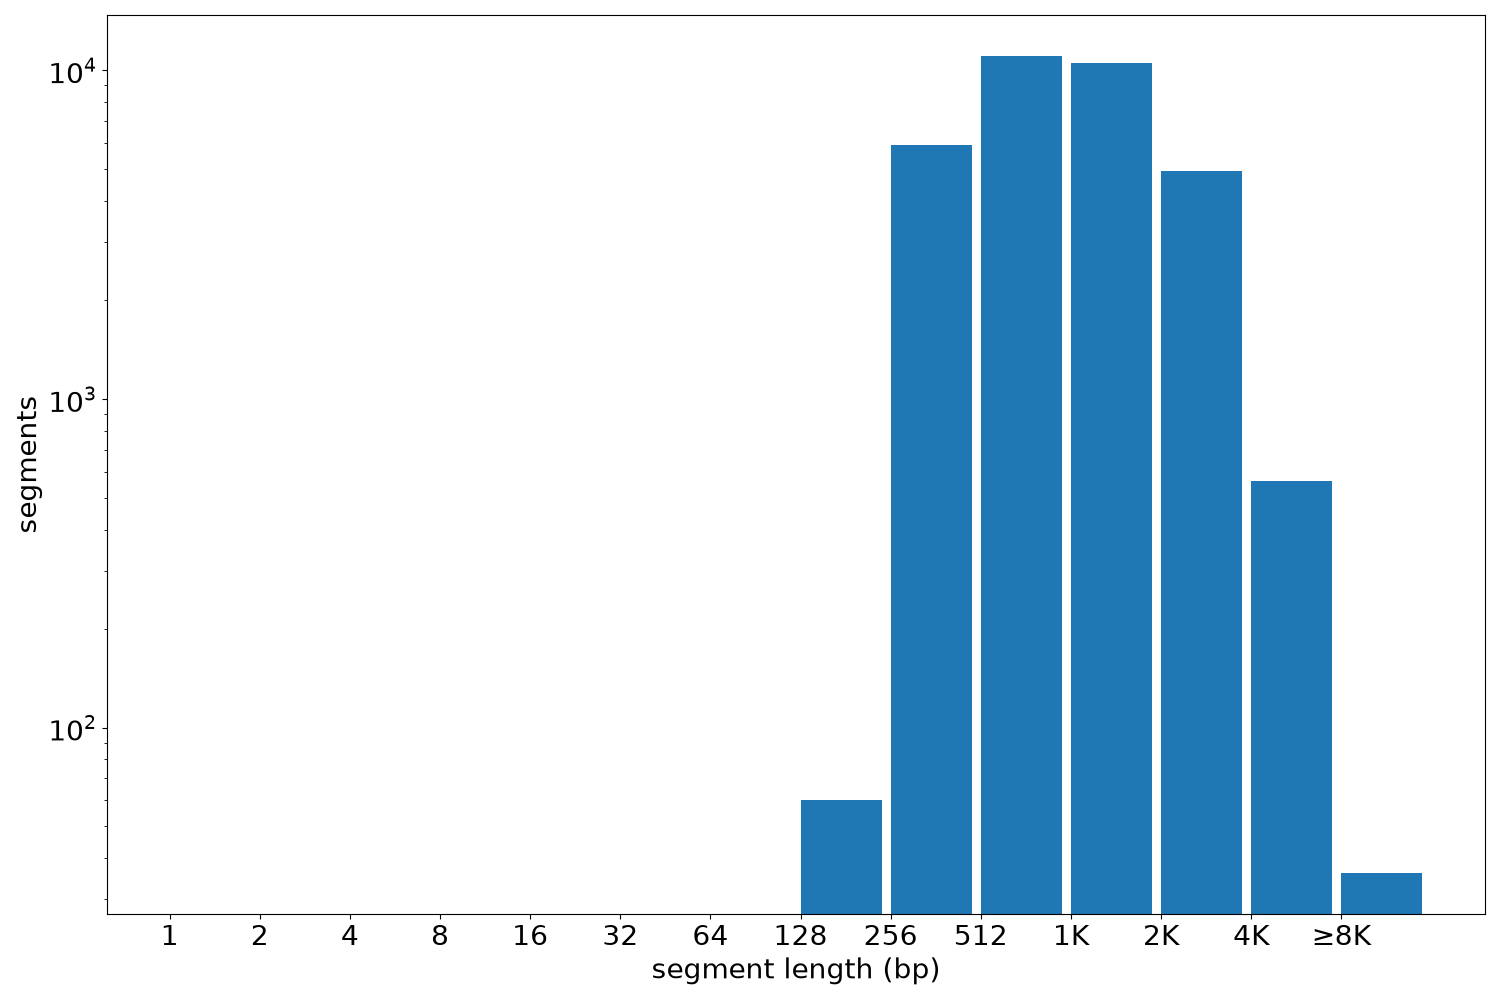
Segment lengths
| segments | min | max | mean | median | |
|---|---|---|---|---|---|
| segments | 33153 | 228 | 18810 | 1281.24 | 993 |
Files
| Filename | Size | md5 |
|---|---|---|
| ENCFF434YII.bed.gz | 882.76 KB | 4db541e14133026795ed9528719014e6 |
| ENCFF434YII.tabix.bed.gz | 376.55 KB | e21150792ae77a9ee8e074b293b5b679 |
| ENCFF434YII.tabix.bed.gz.tbi | 158.71 KB | 2fe0cf2f491aa82fa3f3294119ef2212 |
| genomic_resource.yaml | 2.85 KB | 28e3f22a436ab930026838a4de537398 |
| statistics/ |