Resource
| Id | Histone_ChIP-seq/ENCSR148FWR |
|---|---|
| Type | position_score |
| Version | 0 |
| Summary | Histone_ChIP-seq ENCSR148FWR [biosample_summary="Homo sapiens gastrocnemius medialis tissue male adult (37 years)" and target="H3K4me1"] |
| Description |
status: released biological_replicates: Rep 1 summary: male adult (37 years) output_type: pseudoreplicated peaks audit_internal_action: Released analysis {ENCAN720JLA|/analyses/ENCAN720JLA/} has in progress subobject quality standard {encode4-histone-chip|/quality-standards/encode4-histone-chip/} audit_internal_action: Released analysis {ENCAN720JLA|/analyses/ENCAN720JLA/} has in progress subobject document {bc4f4da6-41a8-4013-afc4-6b7228706234|/documents/bc4f4da6-41a8-4013-afc4-6b7228706234/} audit_warning: PBC1 (PCR Bottlenecking Coefficient 1, M1/M_distinct) is the ratio of the number of genomic locations where exactly one read maps uniquely (M1) to the number of genomic locations where some reads map (M_distinct). A PBC1 value in the range 0 - 0.5 is severe bottlenecking, 0.5 - 0.8 is moderate bottlenecking, 0.8 - 0.9 is mild bottlenecking, and > 0.9 is no bottlenecking. PBC1 value > 0.9 is recommended, but > 0.8 is acceptable. ENCODE processed alignments file {ENCFF573HBD|/files/ENCFF573HBD/} processed by ChIP-seq ENCODE4 v1.5.1 GRCh38 pipeline was generated from a library with PBC1 value of 0.82. audit_warning: PBC2 (PCR Bottlenecking Coefficient 2, M1/M2) is the ratio of the number of genomic locations where exactly one read maps uniquely (M1) to the number of genomic locations where two reads map uniquely (M2). A PBC2 value in the range 0 - 1 is severe bottlenecking, 1 - 3 is moderate bottlenecking, 3 - 10 is mild bottlenecking, > 10 is no bottlenecking. PBC2 value > 10 is recommended, but > 3 is acceptable. ENCODE processed alignments file {ENCFF573HBD|/files/ENCFF573HBD/} processed by ChIP-seq ENCODE4 v1.5.1 GRCh38 pipeline was generated from a library with PBC2 value of 5.49. |
| Labels |
|
Scores (1)
| ID | Type | Default annotation | Description | Histogram | Range | Summary |
|---|---|---|---|---|---|---|
| Histone_ChIP-seq_ENCSR148FWR | float |
Histone_ChIP-seq_ENCSR148FWR |
Histone_ChIP-seq ENCSR148FWR [biosample_summary="Homo sapiens gastrocnemius medialis tissue male adult (37 years)" and target="H3K4me1"]
|
 |
[1.68, 14.3] |
|
n counts base pairs; sd is the population standard deviation.
Coverage
| Chromosome | Covered positions | Covered % | Segments |
|---|---|---|---|
| all chromosomes | 134772323 | 4.19% | 125865 |
| chr1 | 13658504 | 5.49% | 12229 |
| chr2 | 11651671 | 4.81% | 10804 |
| chr3 | 10627737 | 5.36% | 9660 |
| chr4 | 5596455 | 2.94% | 5511 |
| chr5 | 7388732 | 4.07% | 6813 |
| chr6 | 8657595 | 5.07% | 8083 |
| chr7 | 6532016 | 4.10% | 6357 |
| chr8 | 5512784 | 3.80% | 5349 |
| chr9 | 5756572 | 4.16% | 5413 |
| chr10 | 7790556 | 5.82% | 7090 |
| chr11 | 6715661 | 4.97% | 6299 |
| chr12 | 6244641 | 4.69% | 5872 |
| chr13 | 3120853 | 2.73% | 3044 |
| chr14 | 4355293 | 4.07% | 4052 |
| chr15 | 5093949 | 4.99% | 4583 |
| chr16 | 4439106 | 4.91% | 4172 |
| chr17 | 6357513 | 7.64% | 5721 |
| chr18 | 2798277 | 3.48% | 2640 |
| chr19 | 3296682 | 5.62% | 3277 |
| chr20 | 3617835 | 5.61% | 3273 |
| chr21 | 1333913 | 2.86% | 1313 |
| chr22 | 3059161 | 6.02% | 2711 |
| chrX | 1126870 | 0.72% | 1535 |
| chrY | 39947 | 0.07% | 64 |
| 3342 contigs with no values (129077085 bp) | 0 | 0.00% | 0 |
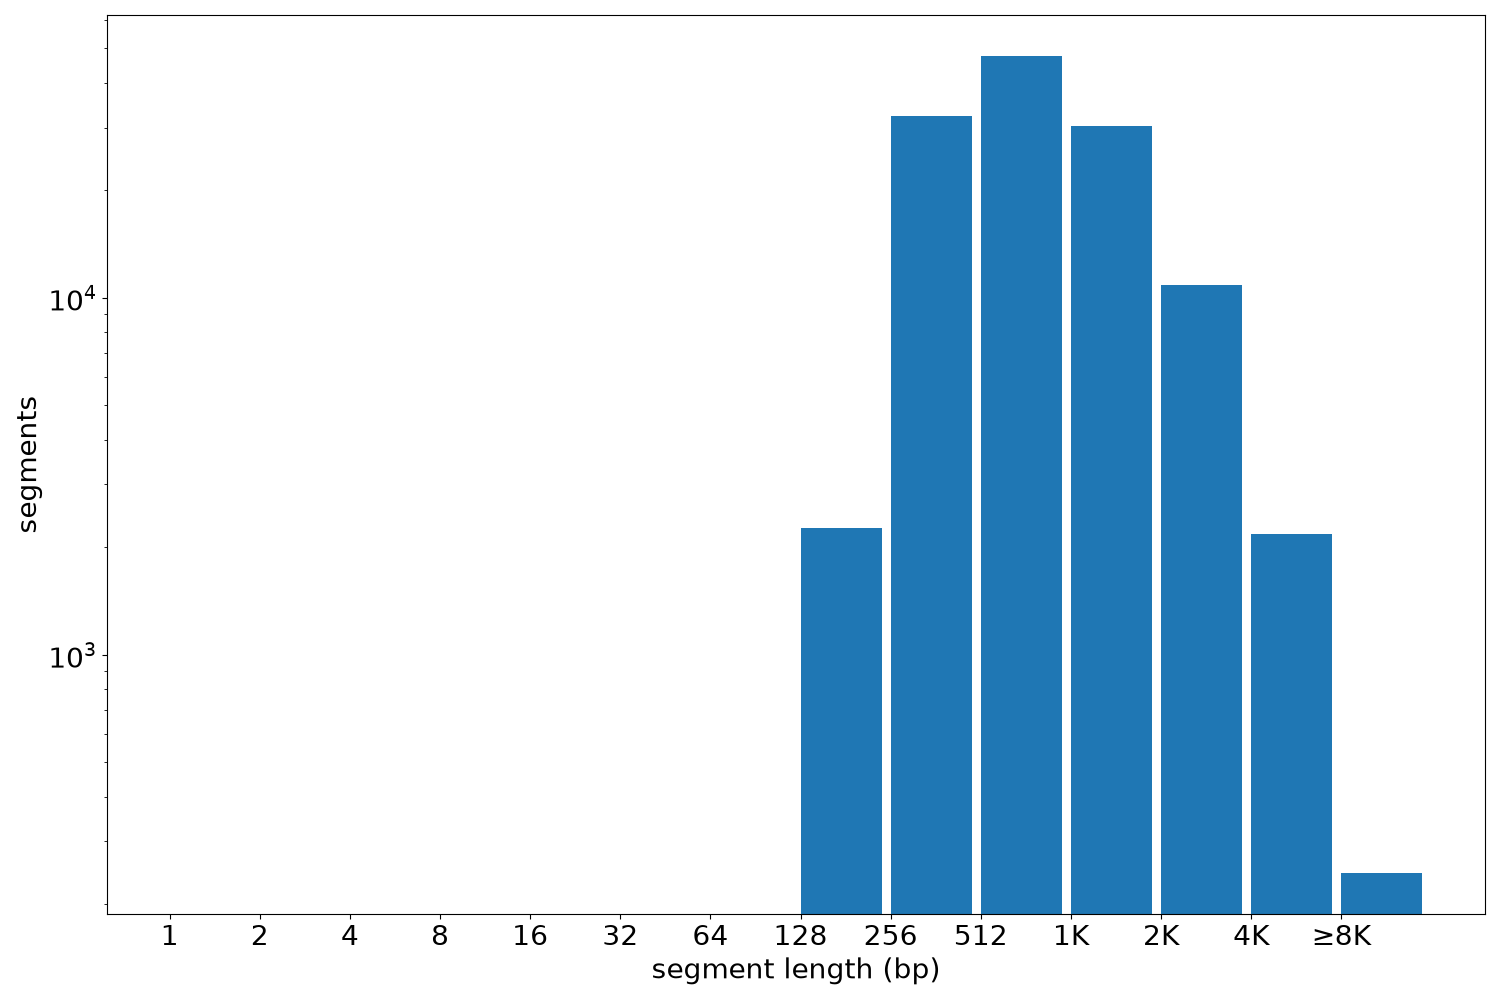
Segment lengths
| segments | min | max | mean | median | |
|---|---|---|---|---|---|
| segments | 125865 | 205 | 24709 | 1070.77 | 763 |
Files
| Filename | Size | md5 |
|---|---|---|
| ENCFF851MDY.bed.gz | 2.7 MB | 9697a9b5a232221aeb83e1676e9c703a |
| ENCFF851MDY.tabix.bed.gz | 1.27 MB | 45a7bd71d6c44d06e0e47d5050fc0e2b |
| ENCFF851MDY.tabix.bed.gz.tbi | 287.09 KB | 59ef04e9a2b276b806deb7e510c7867c |
| genomic_resource.yaml | 3.01 KB | 0778e6ad0be9dc915e864f25cf1e6eab |
| statistics/ |